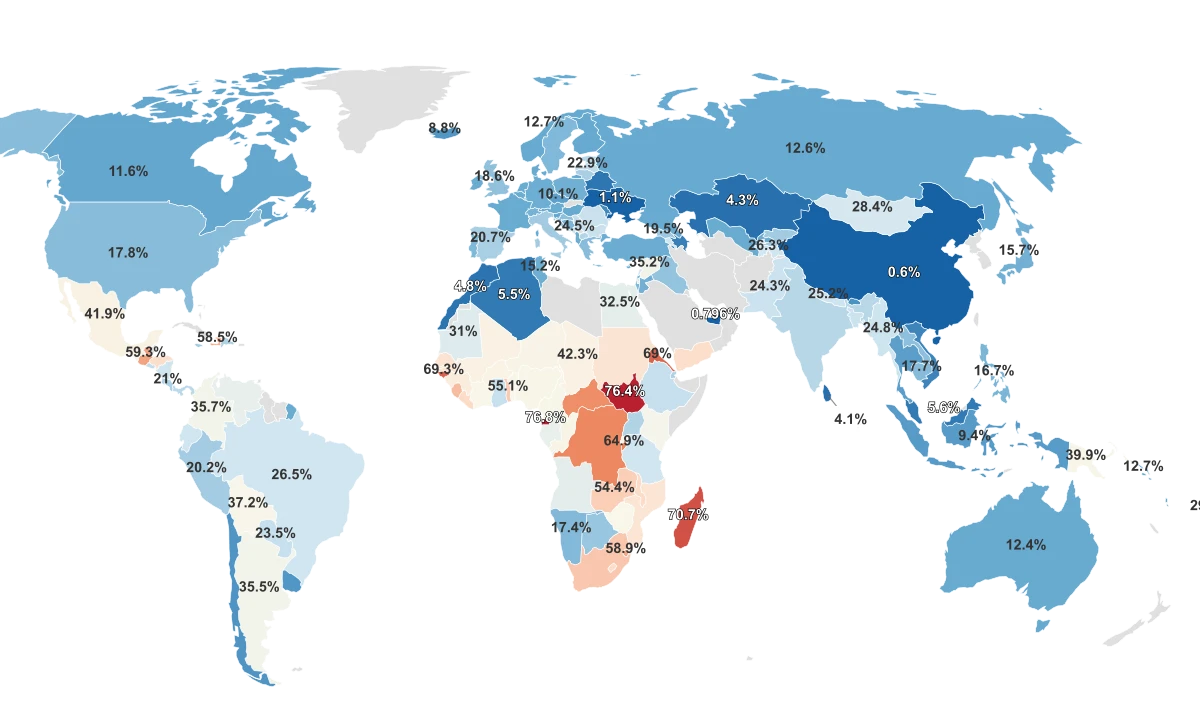
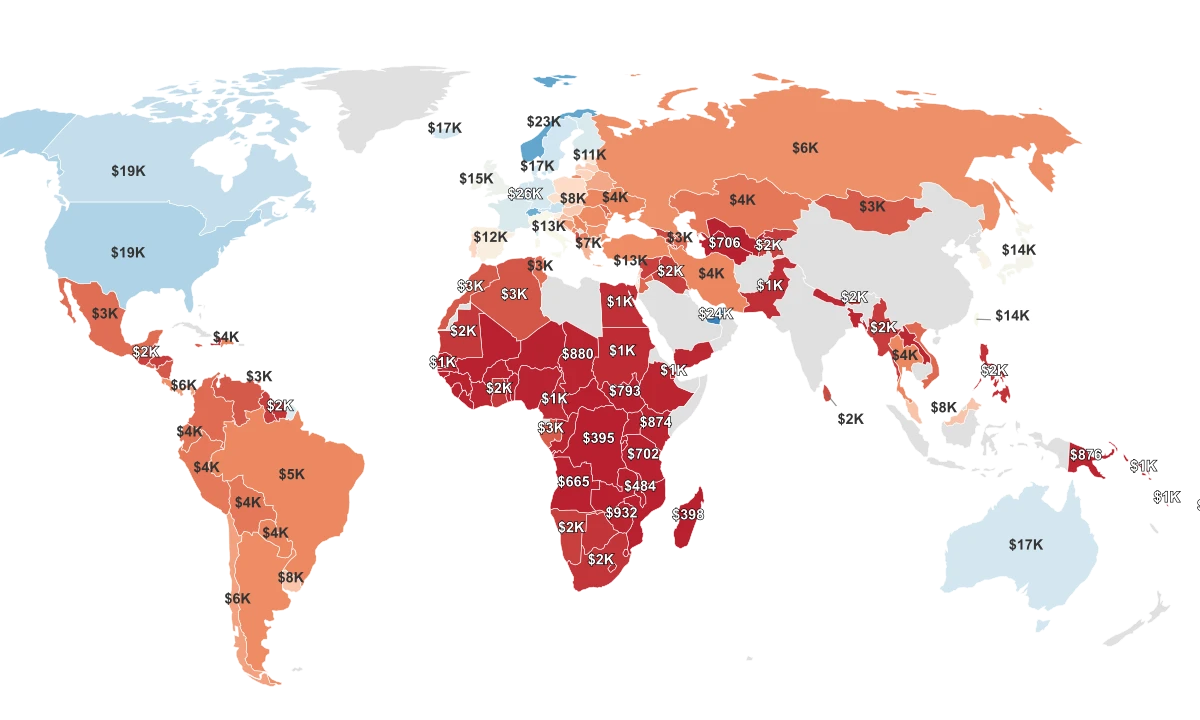
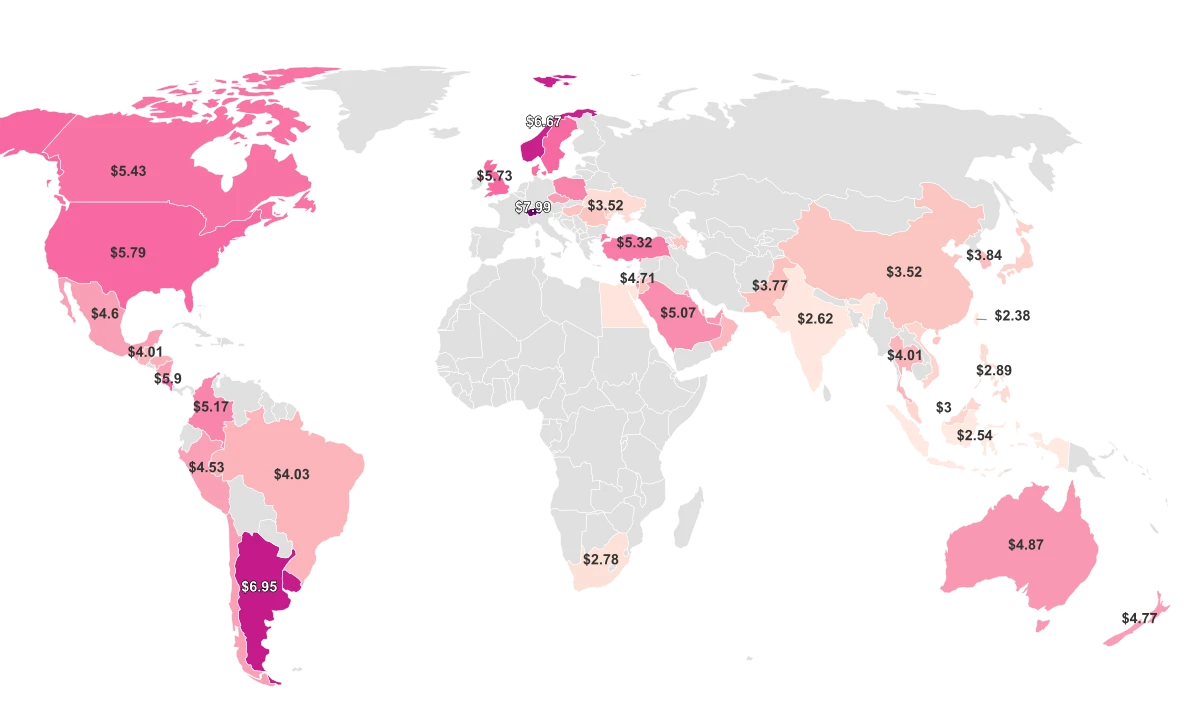
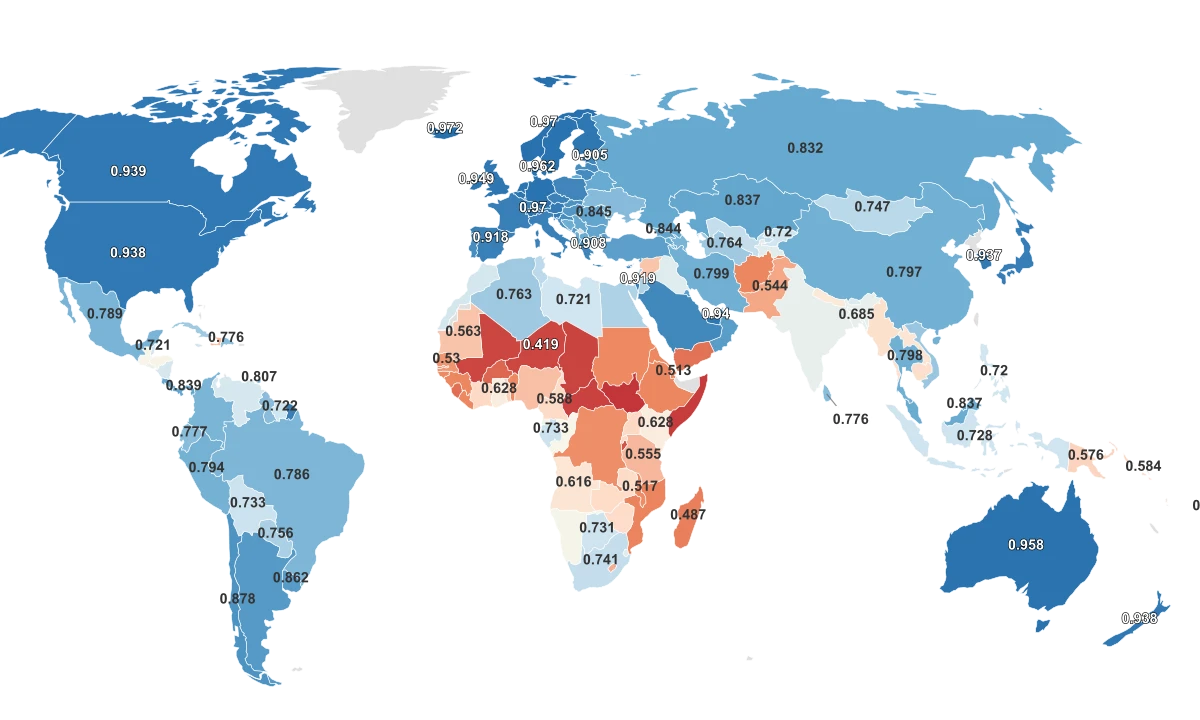
Standard Of Living By Country

1▲2 |  | Iceland | 0.972+0.013 (+1.4%) |
2▼1 |  | Switzerland | 0.97+0.003 (+0.3%) |
2— |  | Norway | 0.97+0.004 (+0.4%) |
4▲1 |  | Denmark | 0.962+0.01 (+1.1%) |
5— |  | Sweden | 0.959+0.007 (+0.7%) |
5▲2 |  | Germany | 0.959+0.009 (+0.9%) |
7▲3 |  | Australia | 0.958+0.012 (+1.3%) |
8▲2 |  | Netherlands | 0.955+0.009 (+1.0%) |
9▲3 |  | Belgium | 0.951+0.009 (+1.0%) |
10▼3 |  | Ireland | 0.949-0.001 (-0.1%) |
11▲1 |  | Finland | 0.948+0.006 (+0.6%) |
12▼3 |  | Singapore | 0.946-0.003 (-0.3%) |
12▲3 |  | United Kingdom | 0.946+0.006 (+0.6%) |
14▲3 |  | United Arab Emirates | 0.94+0.003 (+0.3%) |
15▲3 |  | Canada | 0.939+0.004 (+0.4%) |
16— |  | New Zealand | 0.938-0.001 (-0.1%) |
16▼4 |  | Liechtenstein | 0.938-0.004 (-0.4%) |
16▲4 |  | United States | 0.938+0.011 (+1.2%) |
19— |  | South Korea | 0.937+0.008 (+0.9%) |
20▲2 |  | Slovenia | 0.931+0.005 (+0.5%) |
21▲1 |  | Austria | 0.93+0.004 (+0.4%) |
22▲2 |  | Japan | 0.925+0.005 (+0.5%) |
23▲2 |  | Malta | 0.924+0.009 (+1.0%) |
24▼4 |  | Luxembourg | 0.922-0.005 (-0.5%) |
25▲3 |  | France | 0.92+0.01 (+1.1%) |
26▼1 |  | Israel | 0.919+0.004 (+0.4%) |
27— |  | Spain | 0.918+0.007 (+0.8%) |
28▲2 |  | Italy | 0.915+0.009 (+1.0%) |
28▲15 |  | San Marino | 0.915+0.048 (+5.5%) |
28▲4 |  | Czech Republic | 0.915+0.02 (+2.2%) |
31▲4 |  | Andorra | 0.913+0.029 (+3.3%) |
31▼2 |  | Cyprus | 0.913+0.006 (+0.7%) |
33— |  | Greece | 0.908+0.015 (+1.7%) |
34▲2 |  | Poland | 0.906+0.025 (+2.8%) |
35▼4 |  | Estonia | 0.905+0.006 (+0.7%) |
36▲4 |  | Saudi Arabia | 0.9+0.025 (+2.9%) |
37▼3 |  | Bahrain | 0.899+0.011 (+1.2%) |
38▼1 |  | Lithuania | 0.895+0.016 (+1.8%) |
39▲3 |  | Portugal | 0.89+0.016 (+1.8%) |
40▼3 |  | Latvia | 0.889+0.01 (+1.1%) |
40▼1 |  | Croatia | 0.889+0.011 (+1.3%) |
42▼2 |  | Qatar | 0.886+0.011 (+1.3%) |
43▲2 |  | Slovakia | 0.88+0.025 (+2.9%) |
44— |  | Chile | 0.878+0.018 (+2.1%) |
45▲2 |  | Hungary | 0.87+0.019 (+2.2%) |
46▲2 |  | Argentina | 0.865+0.016 (+1.9%) |
47▲3 |  | Montenegro | 0.862+0.018 (+2.1%) |
47▲5 |  | Uruguay | 0.862+0.032 (+3.9%) |
49▲10 |  | Oman | 0.858+0.039 (+4.8%) |
50▼5 |  | Turkey | 0.853-0.002 (-0.2%) |
51▼2 |  | Kuwait | 0.852+0.005 (+0.6%) |
52▲2 |  | Antigua and Barbuda | 0.851+0.025 (+3.0%) |
53▲14 |  | Seychelles | 0.848+0.046 (+5.7%) |
54▼1 |  | Romania | 0.845+0.018 (+2.2%) |
54▲16 |  | Bulgaria | 0.845+0.046 (+5.8%) |
56▲4 |  | Georgia | 0.844+0.03 (+3.7%) |
57▼6 |  | Saint Kitts and Nevis | 0.84+0.002 (+0.2%) |
58▼1 |  | Panama | 0.839+0.019 (+2.3%) |
59▼4 |  | Brunei | 0.837+0.014 (+1.7%) |
59▲8 |  | Kazakhstan | 0.837+0.035 (+4.4%) |
61▲3 |  | Costa Rica | 0.833+0.027 (+3.3%) |
61▲4 |  | Serbia | 0.833+0.028 (+3.5%) |
63▼7 |  | Russia | 0.832+0.011 (+1.3%) |
64▲5 |  | Belarus | 0.824+0.023 (+2.9%) |
65▼8 |  | Bahamas | 0.82 |
66▼3 |  | Malaysia | 0.819+0.012 (+1.5%) |
67▲16 |  | North Macedonia | 0.815+0.05 (+6.5%) |
68▲8 |  | Armenia | 0.811+0.025 (+3.2%) |
68▼6 |  | Barbados | 0.811+0.002 (+0.2%) |
70▲4 |  | Albania | 0.81+0.021 (+2.7%) |
71▼11 |  | Trinidad and Tobago | 0.807-0.007 (-0.9%) |
72— |  | Mauritius | 0.806+0.01 (+1.3%) |
73▲7 |  | Bosnia and Herzegovina | 0.804+0.025 (+3.2%) |
74▲4 |  | Iran | 0.799+0.019 (+2.4%) |
75▼9 |  | Thailand | 0.798-0.005 (-0.6%) |
75▲6 |  | Saint Vincent and the Grenadines | 0.798+0.026 (+3.4%) |
77▼2 |  | China | 0.797+0.009 (+1.1%) |
78▲9 |  | Peru | 0.794+0.032 (+4.2%) |
79▼6 |  | Grenada | 0.791-0.002 (-0.3%) |
80▼3 |  | Mexico | 0.789+0.008 (+1.0%) |
80▲9 |  | Azerbaijan | 0.789+0.029 (+3.8%) |
82▲9 |  | Colombia | 0.788+0.03 (+4.0%) |
83▲6 |  | Brazil | 0.786+0.026 (+3.4%) |
83▼12 |  | Palau | 0.786-0.011 (-1.4%) |
85▲1 |  | Moldova | 0.785+0.022 (+2.9%) |
86▲14 |  | Ukraine | 0.779+0.045 (+6.1%) |
87▼4 |  | Ecuador | 0.777+0.012 (+1.6%) |
88▲7 |  | Guyana | 0.776+0.034 (+4.6%) |
88▼6 |  | Dominican Republic | 0.776+0.01 (+1.3%) |
88▼10 |  | Sri Lanka | 0.776-0.004 (-0.5%) |
91▲7 |  | Tonga | 0.769+0.03 (+4.1%) |
92▼5 |  | Maldives | 0.766+0.004 (+0.5%) |
92▲15 |  | Vietnam | 0.766+0.04 (+5.5%) |
94— |  | Turkmenistan | 0.764+0.02 (+2.7%) |
95▼2 |  | Algeria | 0.763+0.018 (+2.4%) |
96▼11 |  | Cuba | 0.762-0.002 (-0.3%) |
97— |  | Dominica | 0.761+0.021 (+2.8%) |
98▲4 |  | Paraguay | 0.756+0.025 (+3.4%) |
99▲6 |  | Egypt | 0.754+0.026 (+3.6%) |
99— |  | Jordan | 0.754+0.018 (+2.4%) |
101▲8 |  | Lebanon | 0.752+0.029 (+4.0%) |
102▲6 |  | Saint Lucia | 0.748+0.023 (+3.2%) |
103▼7 |  | Mongolia | 0.747+0.006 (+0.8%) |
104▼3 |  | Tunisia | 0.746+0.014 (+1.9%) |
105▲5 |  | South Africa | 0.741+0.024 (+3.3%) |
106— |  | Uzbekistan | 0.74+0.013 (+1.8%) |
107▼5 |  | Marshall Islands | 0.733+0.002 (+0.3%) |
107▲16 |  | Gabon | 0.733+0.04 (+5.8%) |
107▲13 |  | Bolivia | 0.733+0.035 (+5.0%) |
110▼6 |  | Fiji | 0.731+0.002 (+0.3%) |
110▲4 |  | Botswana | 0.731+0.023 (+3.2%) |
112— |  | Indonesia | 0.728+0.015 (+2.1%) |
113▲11 |  | Suriname | 0.722+0.032 (+4.6%) |
114▼22 |  | Libya | 0.721-0.025 (-3.4%) |
114▲4 |  | Belize | 0.721+0.021 (+3.0%) |
116▼1 |  | Jamaica | 0.72+0.014 (+2.0%) |
116▲1 |  | Kyrgyzstan | 0.72+0.019 (+2.7%) |
116▼3 |  | Philippines | 0.72+0.01 (+1.4%) |
119▲1 |  | Morocco | 0.71+0.012 (+1.7%) |
120▼1 |  | Venezuela | 0.709+0.01 (+1.4%) |
121▼5 |  | Samoa | 0.708+0.006 (+0.9%) |
122▲8 |  | Nicaragua | 0.706+0.037 (+5.5%) |
123▼1 |  | Nauru | 0.703+0.007 (+1.0%) |
124▲1 |  | Bhutan | 0.698+0.017 (+2.5%) |
125▲3 |  | Iraq | 0.695+0.022 (+3.3%) |
125▲17 |  | Eswatini | 0.695+0.085 (+14%) |
127▼1 |  | Tajikistan | 0.691+0.012 (+1.8%) |
128▲4 |  | Tuvalu | 0.689+0.036 (+5.5%) |
129— |  | Bangladesh | 0.685+0.015 (+2.2%) |
129▲5 |  | India | 0.685+0.041 (+6.4%) |
131▼4 |  | El Salvador | 0.678+0.004 (+0.6%) |
132▼21 |  | Palestine | 0.674-0.042 (-5.9%) |
132▲1 |  | Equatorial Guinea | 0.674+0.024 (+3.7%) |
134▼3 |  | Cape Verde | 0.668+0.007 (+1.1%) |
135▲7 |  | Namibia | 0.665+0.055 (+9.0%) |
136— |  | Guatemala | 0.662+0.033 (+5.2%) |
137▲12 |  | Republic of the Congo | 0.649+0.056 (+9.4%) |
138— |  | Honduras | 0.645+0.021 (+3.4%) |
139▼2 |  | Kiribati | 0.644+0.016 (+2.5%) |
140▲1 |  | Sao Tome and Principe | 0.637+0.024 (+3.9%) |
141▲14 |  | Timor Leste | 0.634+0.068 (+12%) |
142▲4 |  | Kenya | 0.628+0.027 (+4.5%) |
142▲3 |  | Ghana | 0.628+0.026 (+4.3%) |
144▲2 |  | Nepal | 0.622+0.021 (+3.5%) |
145▼5 |  | Vanuatu | 0.621+0.007 (+1.1%) |
146▼7 |  | Laos | 0.617-0.003 (-0.5%) |
147▲3 |  | Angola | 0.616+0.025 (+4.2%) |
148▼13 |  | Micronesia | 0.615-0.019 (-3.0%) |
149▼5 |  | Myanmar | 0.609+0.001 (+0.2%) |
150▼2 |  | Cambodia | 0.606+0.006 (+1.0%) |
151▲1 |  | Comoros | 0.603+0.017 (+2.9%) |
152▲7 |  | Zimbabwe | 0.598+0.048 (+8.7%) |
153— |  | Zambia | 0.595+0.026 (+4.6%) |
154▼3 |  | Cameroon | 0.588+0.001 (+0.2%) |
155▲1 |  | Solomon Islands | 0.584+0.022 (+3.9%) |
156▲3 |  | Uganda | 0.582+0.032 (+5.8%) |
156▲10 |  | Ivory Coast | 0.582+0.048 (+9.0%) |
158▲3 |  | Rwanda | 0.578+0.03 (+5.5%) |
159▼5 |  | Papua New Guinea | 0.576+0.008 (+1.4%) |
160▲3 |  | Togo | 0.571+0.024 (+4.4%) |
161▼4 |  | Syria | 0.564+0.007 (+1.3%) |
162▲2 |  | Mauritania | 0.563+0.023 (+4.3%) |
163▼2 |  | Nigeria | 0.56+0.012 (+2.2%) |
164▲3 |  | Tanzania | 0.555+0.023 (+4.3%) |
165▼7 |  | Haiti | 0.554+0.002 (+0.4%) |
166▲2 |  | Lesotho | 0.55+0.029 (+5.6%) |
167▼3 |  | Pakistan | 0.544+0.004 (+0.7%) |
168▲1 |  | Senegal | 0.53+0.013 (+2.5%) |
169▲5 |  | Gambia | 0.524+0.029 (+5.9%) |
170▲10 |  | DR Congo | 0.522+0.041 (+8.5%) |
171▲1 |  | Malawi | 0.517+0.009 (+1.8%) |
172▲1 |  | Benin | 0.515+0.011 (+2.2%) |
173▲6 |  | Guinea Bissau | 0.514+0.031 (+6.4%) |
174▼3 |  | Djibouti | 0.513-0.002 (-0.4%) |
175▼5 |  | Sudan | 0.511-0.005 (-1.0%) |
176▲1 |  | Liberia | 0.51+0.023 (+4.7%) |
177▼2 |  | Eritrea | 0.503+0.01 (+2.0%) |
178▲3 |  | Guinea | 0.5+0.029 (+6.2%) |
179▼3 |  | Ethiopia | 0.497+0.005 (+1.0%) |
180▲2 |  | Afghanistan | 0.496+0.034 (+7.4%) |
181▲2 |  | Mozambique | 0.493+0.032 (+6.9%) |
182▼5 |  | Madagascar | 0.487 |
183▲3 |  | Yemen | 0.47+0.046 (+11%) |
184— |  | Sierra Leone | 0.467+0.009 (+2.0%) |
185— |  | Burkina Faso | 0.459+0.021 (+4.8%) |
186▲1 |  | Burundi | 0.439+0.019 (+4.5%) |
187▲1 |  | Mali | 0.419+0.009 (+2.2%) |
187▲2 |  | Niger | 0.419+0.025 (+6.3%) |
189— |  | Chad | 0.416+0.022 (+5.6%) |
190▲1 |  | Central African Republic | 0.414+0.027 (+7.0%) |
191▲2 |  | Somalia | 0.404+0.024 (+6.3%) |
192— |  | South Sudan | 0.388+0.007 (+1.8%) |
Last updated June 25, 2026
Key Takeaways
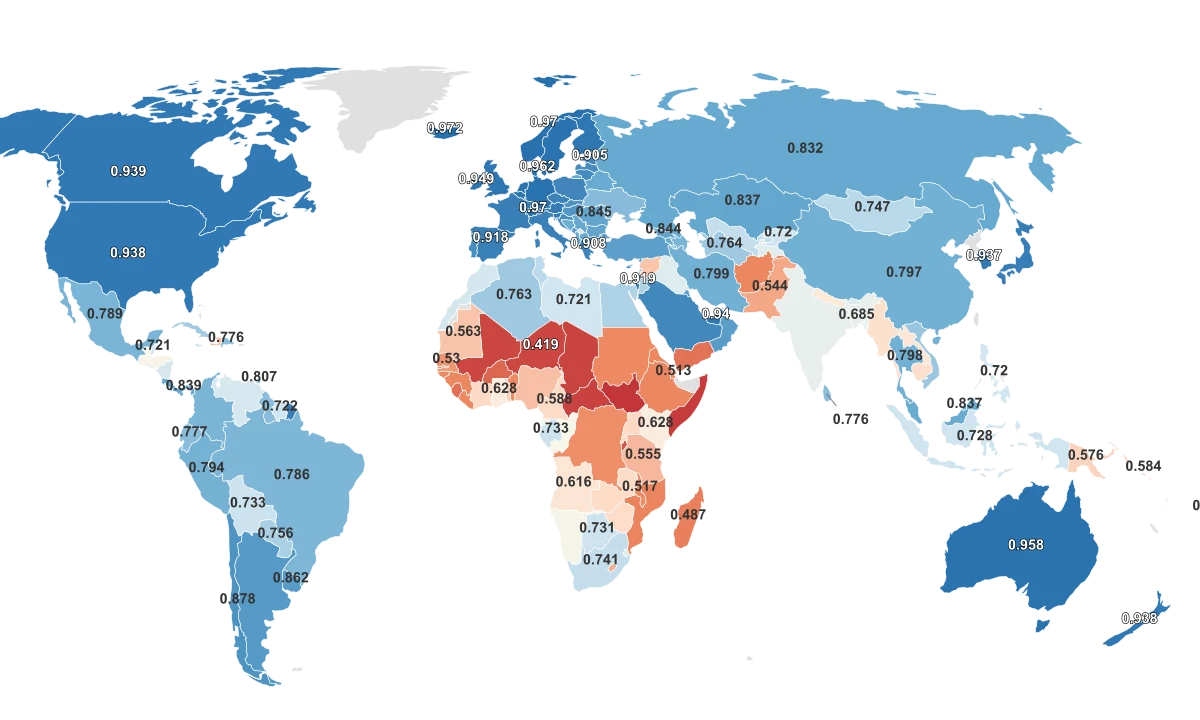
- Iceland offers the highest standard of living of any country the UNDP scores, with a Human Development Index of 0.972.
- South Sudan sits last at 0.388, and a cluster of Sahel and Horn-of-Africa nations falls far below the rest of the world.
- The income a country earns explains only about two-thirds of where it lands, leaving the rest to how it spends that money on health and schooling.
- Qatar is one of the three richest countries per person, yet its standard of living ranks only 42nd.
All Metrics
One Score Folds a Long Life, a Schooling, and a Paycheck Into a Single Number
When people ask which country has the best standard of living, the closest thing to an official answer is the Human Development Index, published by the United Nations Development Programme. Iceland leads the world at 0.972, and South Sudan trails at 0.388. A higher score is better: it means longer lives, more schooling, and higher incomes, packed into a single number between 0 and 1.
The index does something a paycheck cannot. The UNDP combines three things a good life needs, a long and healthy life, a real education, and a decent income, and folds them together as a geometric mean. The 2023 figures come from the agency's 2025 Human Development Report. Because all three dimensions have to be strong at once, the countries at the very top are not just rich. They are balanced.
The leaders bunch tightly. Switzerland and Norway sit just behind Iceland, all three within a whisker of 0.97, the heart of the UNDP's top band. The bottom of the table tells the harder story. South Sudan, Somalia, the Central African Republic, and Chad form a low cluster in the Sahel and the Horn of Africa, each more than two standard distances below the global average, a depth no country's lead at the top can match.
That gap is not random. The World Bank ties the region's struggles to fragility, climate shocks, and displacement, recording 44.8% of Chad living below the national poverty line in 2022. The 2025 report frames the wider pattern as widening inequality between rich and poor countries. Money is part of why. It is not all of it.
Qatar Is One of the Three Richest Countries. It Ranks 42nd in Human Development.
Here is the thing the rankings keep proving: a high standard of living is mostly bought with money, but not entirely. Across the countries with both figures, income and human development move strongly together. Yet income explains only about 63% of the differences between nations, which leaves more than a third of the story to something else: whether a country turns its wealth into longer lives and more years of school.
The clearest evidence sits in the petro-economies. Qatar is one of the three richest countries on earth per person, at roughly $129,000. Its standard of living ranks only 42nd. Guyana, riding an oil boom into the top third of the world by income, lands all the way down at 88th in human development. Both are rich on paper and middling in life outcomes.
Money Buys Most of a Good Life, Not All of It
Richer countries score higher on human development, but the wealthiest petro-economies fall well below the line their incomes would predict.
The UNDP built the index to expose exactly this. Its income pillar uses the logarithm of national income, which deliberately discounts each extra dollar at the very top, on the logic that the difference between $20,000 and $40,000 changes a life far more than the difference between $120,000 and $140,000. That is why oil-and-gas wealth does not lift the score one for one. A country can be flush with export revenue and still fall short on the schooling and longevity the index rewards.
China Nearly Doubled Its Human Development Score in a Generation
Step back three decades and the dominant story is not the gap between countries. It is how far the floor has risen. Among the nations measured in both years, the global standard of living climbed about 26% between 1990 and 2023. The rising tide lifted developing Asia fastest.
No country moved more in raw terms than China, whose index jumped from 0.484 to 0.797, a gain of more than 0.31 points that nearly doubled its score in a single generation. Turkey tells the other half of the story: it did not post the biggest jump in value, but it climbed 29 places in the world rankings, more than any other country, a reminder that standing still while neighbors improve is its own kind of falling behind.
The World's Standard of Living Has Climbed, but Not Everywhere
Human Development Index from 1990 to 2023, where developing Asia surged and a handful of conflict-hit nations slid backward.
Showing 51 of 141 regions · Sorted by: Highest to Lowest · 90 not shown
Not every arrow points up. War and collapse can run the film in reverse. Syria is the starkest case: its score barely moved in absolute terms, but as the rest of the world advanced, it slid 70 places down the rankings, the worst slide of any country in the data. Human development, it turns out, is something a country can lose as well as build.
What the Index Counts, and the 36 Countries It Leaves Out
Before drawing firm conclusions, it helps to know what the map does not show. The 2023 index scores 192 of the 228 places on the UNDP's list, so the cleanest way to read any global claim here is "of the countries the UNDP scores." Small states and a handful of territories simply are not measured, which is why some familiar names never appear.
The historical comparison rests on thinner ground still. The 1990 baseline covered only 142 countries, so the long-run rise and the standout movers describe the nations present in both snapshots, not the entire world. The trend is real. It is just not universal.
One last guardrail is worth stating plainly. A high standard of living does not mean a cheap one, and the crowd-sourced Numbeo cost-of-living figures that accompany this data are a 2026 aggregator estimate, not an official statistic, so they are best read as a rough gauge rather than a verdict. The Human Development Index is the opposite: a transparent, replicable composite that measures something raw economic output cannot. A country's gross output tells you how much it earns. This number gets closer to how well it lives.
Sources & Notes
Measure of overall human development combining life expectancy, education, and income levels.
Economic output per person adjusted for cost of living differences.
estimates the relative price of consumer goods like groceries, restaurants, transportation, and utilities — but excludes rent.
Average number of years a newborn is expected to live.