Big Mac Index by Country

1 | Switzerland | $7.99 | |
2 | Argentina | $6.95 | |
3 | Uruguay | $6.91 | |
4 | Norway | $6.67 | |
5 | Costa Rica | $5.9 | |
6 | United States | $5.79 | |
7 | United Kingdom | $5.73 | |
8 | Sweden | $5.67 | |
9 | Denmark | $5.49 | |
10 | Canada | $5.43 | |
11 | Turkey | $5.32 | |
12 | Poland | $5.21 | |
13 | Singapore | $5.17 | |
13 | Colombia | $5.17 | |
15 | Saudi Arabia | $5.07 | |
16 | United Arab Emirates | $4.9 | |
17 | Australia | $4.87 | |
18 | New Zealand | $4.77 | |
19 | Israel | $4.71 | |
20 | Mexico | $4.6 | |
21 | Czech Republic | $4.56 | |
22 | Chile | $4.55 | |
23 | Kuwait | $4.54 | |
24 | Peru | $4.53 | |
25 | Bahrain | $4.51 | |
26 | Nicaragua | $4.48 | |
27 | Honduras | $4.12 | |
27 | Qatar | $4.12 | |
29 | Brazil | $4.03 | |
30 | Thailand | $4.01 | |
30 | Guatemala | $4.01 | |
32 | Oman | $3.97 | |
33 | South Korea | $3.84 | |
34 | Pakistan | $3.77 | |
35 | Azerbaijan | $3.67 | |
36 | Hungary | $3.65 | |
37 | Jordan | $3.53 | |
38 | Moldova | $3.52 | |
38 | China | $3.52 | |
40 | Romania | $3.43 | |
41 | Japan | $3.11 | |
42 | Hong Kong | $3.08 | |
43 | Vietnam | $3.03 | |
44 | Malaysia | $3 | |
45 | Philippines | $2.89 | |
46 | Ukraine | $2.86 | |
47 | South Africa | $2.78 | |
48 | Egypt | $2.69 | |
49 | India | $2.62 | |
50 | Indonesia | $2.54 | |
51 | Taiwan | $2.38 |
Last updated April 1, 2026
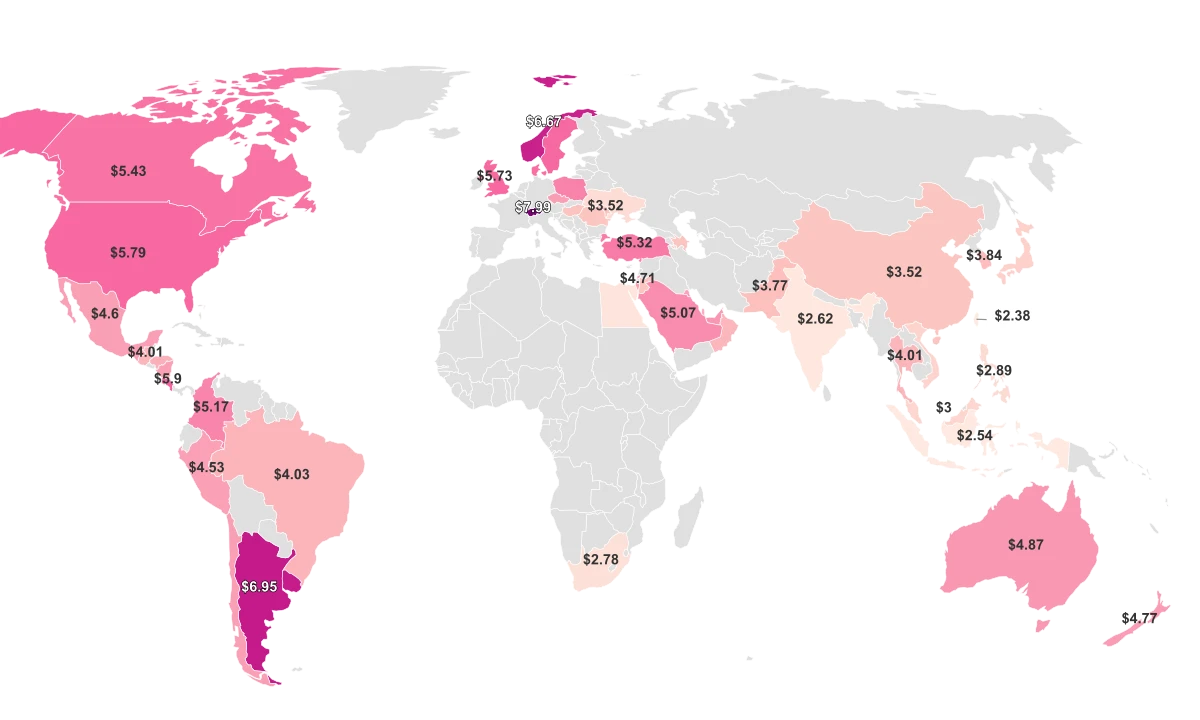
A $7.99 Burger in Zurich, a $2.38 Burger in Taipei
In 1986, The Economist started comparing the price of a McDonald's Big Mac across countries as a lighthearted way to measure whether currencies were overvalued or undervalued against the U.S. dollar. The logic was simple: a Big Mac is essentially the same product everywhere, so price differences, once converted to dollars, should reveal something about exchange rates. Four decades later, the Big Mac Index remains one of the most widely cited informal gauges of purchasing power parity in the world.
The 2025 data covers 51 countries where McDonald's operates and pricing is available. Switzerland leads at $7.99 per burger, $2.20 more than the United States benchmark of $5.79. At the other end, Taiwan sits last at $2.38, meaning a Big Mac there costs less than half what it costs in America. The full gap top to bottom is $5.61.
Between those extremes, the ranking splits into recognizable tiers. Wealthy Northern European countries cluster near the top: Norway ($6.67), Sweden ($5.67), and Denmark ($5.49) all sit above $5.00. A broad middle tier stretches from Australia ($4.87) through Brazil ($4.03) and Thailand ($4.01). The cheapest Big Macs are overwhelmingly in Asia: Indonesia ($2.54), India ($2.62), and Vietnam ($3.03) join Taiwan at the bottom.
But the ranking also contains some results that do not fit the pattern at all. Argentina, a country in the grip of an economic crisis, has the second most expensive Big Mac on the planet at $6.95. Japan, the world's fourth-largest economy, pays just $3.11. The Big Mac Index was designed to catch exactly these kinds of distortions, and both cases are driven by the same force: exchange rate policy.
All Metrics
| Region ↕ | Big Mac Index 2025↕ | Cost of Living Index 2026↕ | GDP Per Capita PPP 2023↕ | Inflation Rate 2026↕ |
|---|---|---|---|---|
| Switzerland | $7.99 | |||
| Argentina | $6.95 | |||
| Uruguay | $6.91 | |||
| Norway | $6.67 | |||
| Costa Rica | $5.90 | |||
| United States | $5.79 | |||
| United Kingdom | $5.73 | |||
| Sweden | $5.67 | |||
| Denmark | $5.49 | |||
| Canada | $5.43 | |||
| Turkey | $5.32 | |||
| Poland | $5.21 | |||
| Singapore | $5.17 | |||
| Colombia | $5.17 | |||
| Saudi Arabia | $5.07 | |||
| United Arab Emirates | $4.90 | |||
| Australia | $4.87 | |||
| New Zealand | $4.77 | |||
| Israel | $4.71 | |||
| Mexico | $4.60 | |||
| Czech Republic | $4.56 | |||
| Chile | $4.55 | |||
| Kuwait | $4.54 | |||
| Peru | $4.53 | |||
| Bahrain | $4.51 | |||
| Nicaragua | $4.48 | |||
| Honduras | $4.12 | |||
| Qatar | $4.12 | |||
| Brazil | $4.03 | |||
| Thailand | $4.01 | |||
| Guatemala | $4.01 | |||
| Oman | $3.97 | |||
| South Korea | $3.84 | |||
| Pakistan | $3.77 | |||
| Azerbaijan | $3.67 | |||
| Hungary | $3.65 | |||
| Jordan | $3.53 | |||
| Moldova | $3.52 | |||
| China | $3.52 | |||
| Romania | $3.43 | |||
| Japan | $3.11 | |||
| Hong Kong | $3.08 | |||
| Vietnam | $3.03 | |||
| Malaysia | $3.00 | |||
| Philippines | $2.89 | |||
| Ukraine | $2.86 | |||
| South Africa | $2.78 | |||
| Egypt | $2.69 | |||
| India | $2.62 | |||
| Indonesia | $2.54 | |||
| Taiwan | $2.38 |
Argentina's Big Mac Costs More Than America's. That Is Not a Good Sign.
If the Big Mac Index measured how expensive a country feels to live in, Argentina would be nowhere near the top. Its cost of living index score is 41.3, roughly 40% cheaper than the United States (68.8) and cheaper than Romania, Bulgaria, and Guatemala. Argentines are not living in a high-cost economy. Yet the Big Mac Index says a burger there costs $6.95, placing it above every country in Western Europe except Switzerland.
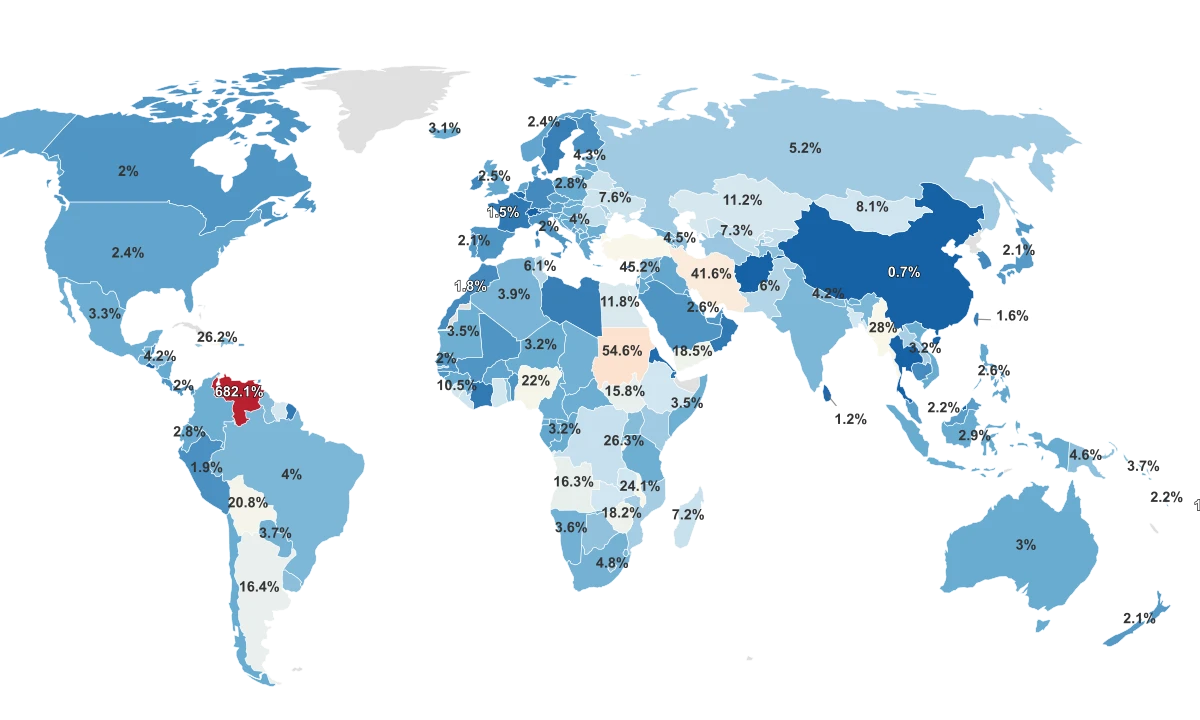
The explanation is currency mechanics, not purchasing power. After President Javier Milei took office in late 2023, his administration implemented a "crawling peg" policy that deliberately slowed the rate of peso devaluation against the dollar. The goal was to anchor inflation expectations. It worked: inflation fell from triple-digit levels. But domestic prices had already adjusted upward, and the peso was not devalued fast enough to keep pace. The result was a sharp appreciation of the real exchange rate.
In plain terms, the peso became stronger on paper while the economy did not. Local prices, including a Big Mac, stayed high in peso terms. When converted to dollars at the artificially stable exchange rate, those prices look enormous. Uruguay ($6.91) sits right behind Argentina at third place, reflecting a similar dynamic in which a strong local currency inflates the dollar-denominated price.
Turkey ($5.32) illustrates a different version of this story. Its inflation rate is 24.7%, among the highest of any country in the Big Mac dataset. Despite that, the Turkish Big Mac is still more expensive than those in Australia, New Zealand, or Israel, because the lira has not weakened as quickly as inflation would predict. These are not wealthy economies with expensive burgers. They are economies where currency distortions make everything look more expensive in dollar terms than it actually is for the people living there.
Japan's $3.11 Big Mac Shows What a Weak Currency Looks Like
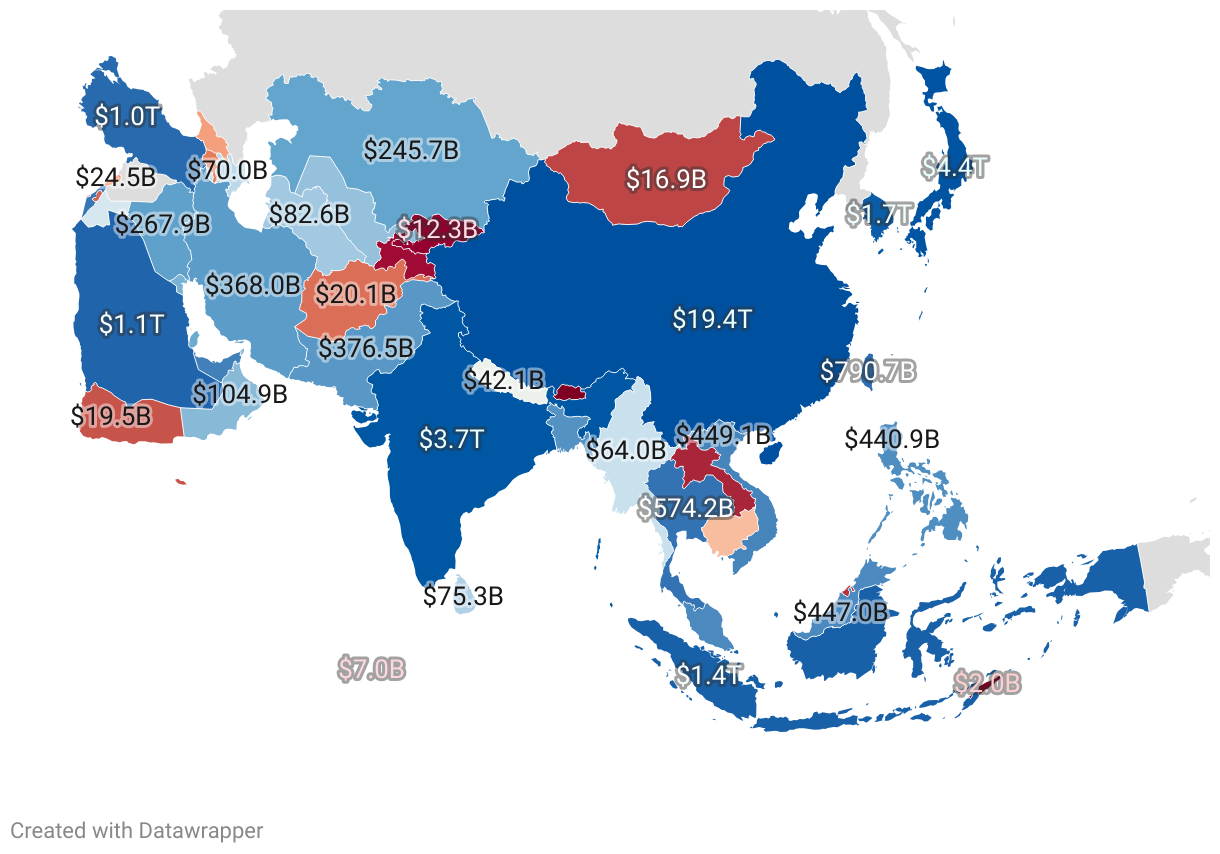
Japan is a high-income country with a GDP per capita that ranks among the top 30 globally. Its cost of living index in 2022 was 77.0, higher than Canada, the United Kingdom, or Germany. Three years later, that index has fallen to 47.5, a decline of nearly 38%. The Big Mac tells the same story: at $3.11, Japan's burger costs 46% less than in the United States.
The cause is a single variable: the yen. The Bank of Japan maintained near-zero interest rates for years while the U.S. Federal Reserve aggressively raised its own. The resulting gap made yen-denominated assets less attractive, pushing the currency down. McDonald's Japan raised its Big Mac price from ¥480 to ¥500 in early 2026, but when converted to dollars at the weakened exchange rate, that still comes out to just $3.11.
This creates a paradox that the Big Mac Index captures perfectly. For a tourist arriving with dollars, Japan is a bargain. For a resident earning in yen, everything imported, from fuel to food ingredients, has become more expensive without a matching increase in wages. The cheap Big Mac is not a sign of affordability. It is a sign that the currency is buying less on the global stage.
Switzerland is the mirror image. Its Big Mac costs $7.99, the highest in the world, because the Swiss franc is exceptionally strong and Swiss wages are among the highest anywhere. The country's cost of living index is 110.7, the only major economy above 100 besides Bermuda and the Cayman Islands. Switzerland's inflation rate is just 0.6%. The expensive Big Mac reflects a structurally expensive economy, not a currency distortion. The gap between Japan's $3.11 and Switzerland's $7.99, nearly $5 per burger, is the clearest illustration of how exchange rates reshape the price of an identical product.
What the Big Mac Index Gets Right, and What It Misses
The Big Mac Index was never designed to be a precise financial tool. The Economist itself describes it as a "semi-humorous" illustration of purchasing power parity, and the Federal Reserve Bank of St. Louis has featured it as an accessible entry point for teaching the concept. It works best as a quick visual shorthand: when a Big Mac costs twice as much in one country as another, something meaningful is happening with either wages, prices, or exchange rates.
At the broadest level, the intuition holds up. Big Mac prices track the cost of living index with a strong positive relationship across the 51 countries where both metrics are available. Countries where consumer goods are generally expensive, like Switzerland, Norway, and Denmark, charge more for a Big Mac. Countries where goods are cheap, like India, Indonesia, and Egypt, charge less. The pattern is real.
Big Mac Prices Track Cost of Living, With Some Dramatic Exceptions
Countries above the trendline, like Argentina and Turkey, pay more for a Big Mac than their broader cost of living would predict.
But the exceptions are just as revealing as the trend. Argentina and Turkey sit well above the trendline, paying far more for a Big Mac than their overall cost structure would suggest, because exchange rate distortions inflate the dollar price. Japan and Hong Kong ($3.08) sit well below it, with Big Mac prices that understate how expensive these cities actually are to live in, because weak or pegged currencies deflate the dollar conversion.
The deeper limitation is structural. A Big Mac is not a traded commodity. Its price includes local rent, local wages, local taxes, and local supply chain costs, none of which can be arbitraged across borders. A country with high minimum wages will always have an expensive Big Mac, regardless of whether its currency is fairly valued. That is why The Economist also publishes a GDP-adjusted version of the index, which corrects for the fact that poorer countries naturally have lower prices. In that adjusted version, many of the extremes shrink: India's Big Mac is no longer alarmingly cheap, and Switzerland's is no longer quite so shocking. The index remains useful, but what it measures is simpler than it seems: not whether a currency is right or wrong, but what a dollar buys you when you walk into a McDonald's.
Sources & Notes
A measure of purchasing power parity (PPP) between countries, created by The Economist, that compares the price of a McDonald's Big Mac burger across nations.
estimates the relative price of consumer goods like groceries, restaurants, transportation, and utilities — but excludes rent.
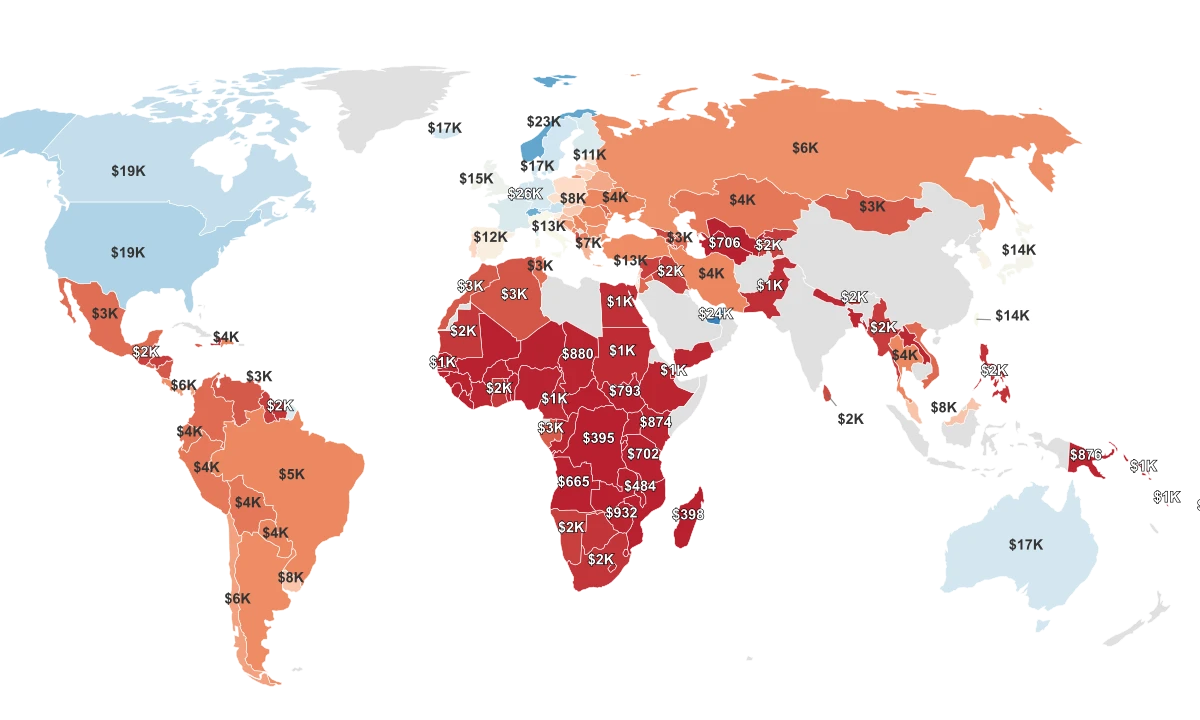
Economic output per person adjusted for cost of living differences.
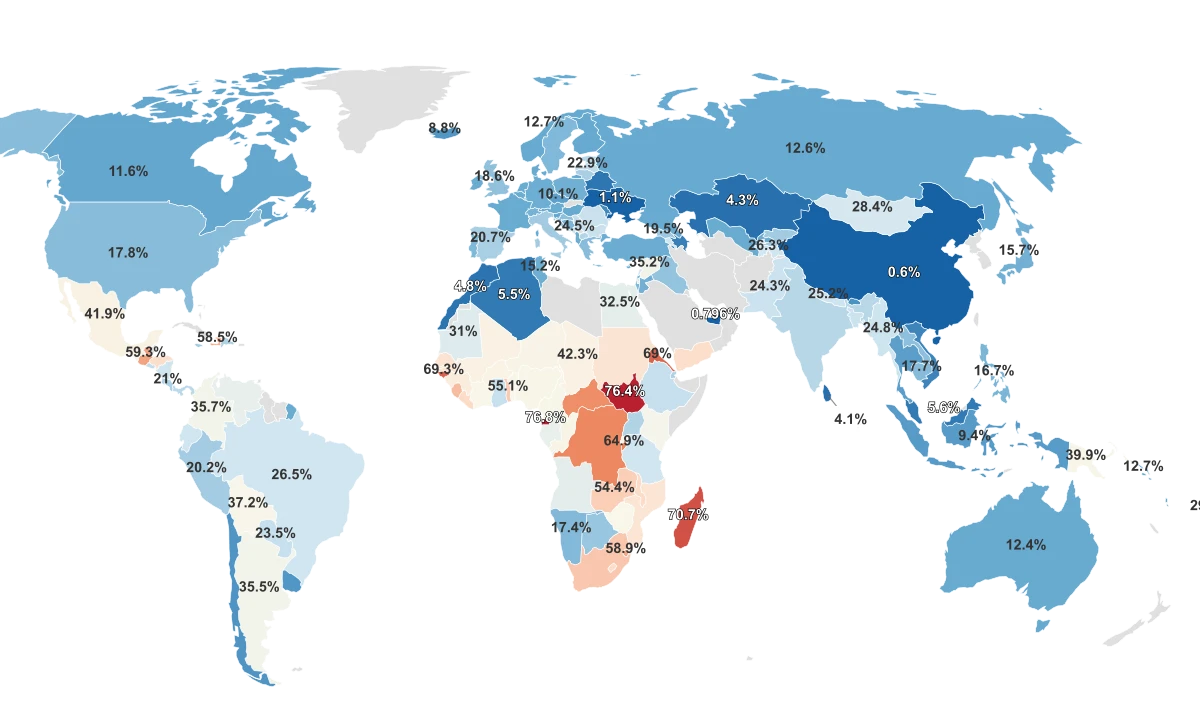
% increase in the general price level of goods and services.