Poverty Rate By Country

1 | Equatorial Guinea | 76.8% | |
2 | South Sudan | 76.4% | |
3 | Madagascar | 70.7% | |
4 | Guinea Bissau | 69.3% | |
5 | Eritrea | 69% | |
6 | Sao Tome and Principe | 66.7% | |
7 | Burundi | 64.9% | |
8 | DR Congo | 63.9% | |
9 | Central African Republic | 62% | |
10 | Guatemala | 59.3% | |
11 | Eswatini | 58.9% | |
12 | Haiti | 58.5% | |
13 | Sierra Leone | 56.8% | |
14 | South Africa | 55.5% | |
15 | Togo | 55.1% | |
16 | Zambia | 54.4% | |
17 | Malawi | 51.5% | |
18 | Liberia | 50.9% | |
19 | Lesotho | 49.7% | |
20 | Gambia | 48.6% | |
20 | Yemen | 48.6% | |
22 | Honduras | 48.3% | |
23 | Senegal | 46.7% | |
24 | Sudan | 46.5% | |
25 | Mozambique | 46.1% | |
26 | Guinea | 43.7% | |
27 | Comoros | 42.4% | |
28 | Chad | 42.3% | |
29 | Mali | 42.1% | |
30 | Mexico | 41.9% | |
31 | Timor Leste | 41.8% | |
32 | Burkina Faso | 41.4% | |
33 | Micronesia | 41.2% | |
34 | Republic of the Congo | 40.9% | |
35 | Niger | 40.8% | |
36 | Nigeria | 40.1% | |
37 | Papua New Guinea | 39.9% | |
38 | Ivory Coast | 39.5% | |
39 | Benin | 38.5% | |
40 | Zimbabwe | 38.3% | |
41 | Rwanda | 38.2% | |
42 | Cameroon | 37.5% | |
43 | Bolivia | 37.2% | |
44 | Kenya | 36.1% | |
45 | Colombia | 35.7% | |
46 | Argentina | 35.5% | |
47 | Syria | 35.2% | |
48 | Gabon | 33.4% | |
49 | Venezuela | 33.1% | |
50 | Egypt | 32.5% | |
51 | Angola | 32.3% | |
52 | Mauritania | 31% | |
53 | Fiji | 29.9% | |
54 | Palestine | 29.2% | |
55 | Mongolia | 28.4% | |
56 | Lebanon | 27.4% | |
57 | Brazil | 26.5% | |
58 | Tanzania | 26.4% | |
58 | Armenia | 26.4% | |
60 | Tajikistan | 26.3% | |
60 | Tuvalu | 26.3% | |
62 | Seychelles | 25.3% | |
63 | Nepal | 25.2% | |
64 | Ecuador | 25% | |
64 | Saint Lucia | 25% | |
66 | Nicaragua | 24.9% | |
66 | Palau | 24.9% | |
68 | Myanmar | 24.8% | |
69 | Montenegro | 24.5% | |
70 | Pakistan | 24.3% | |
70 | Bangladesh | 24.3% | |
72 | Romania | 23.8% | |
72 | Bulgaria | 23.8% | |
74 | Paraguay | 23.5% | |
74 | Ethiopia | 23.5% | |
76 | Ghana | 23.4% | |
77 | Serbia | 23.2% | |
78 | Latvia | 22.9% | |
79 | El Salvador | 22.8% | |
80 | Tonga | 22.5% | |
81 | Panama | 22.1% | |
82 | India | 21.9% | |
83 | Kiribati | 21.8% | |
84 | Estonia | 21.7% | |
85 | North Macedonia | 21.6% | |
86 | Uganda | 21.4% | |
87 | Djibouti | 21.1% | |
88 | Costa Rica | 21% | |
88 | Dominican Republic | 21% | |
90 | Spain | 20.7% | |
91 | Lithuania | 20.6% | |
92 | Samoa | 20.3% | |
93 | Peru | 20.2% | |
94 | Italy | 20.1% | |
94 | Kyrgyzstan | 20.1% | |
96 | Jamaica | 19.9% | |
97 | Georgia | 19.5% | |
98 | Botswana | 19.3% | |
99 | Iraq | 18.9% | |
100 | United Kingdom | 18.6% | |
101 | Croatia | 18.3% | |
101 | Laos | 18.3% | |
103 | Greece | 17.9% | |
104 | United States | 17.8% | |
105 | Cambodia | 17.7% | |
106 | Luxembourg | 17.5% | |
107 | Namibia | 17.4% | |
108 | Portugal | 17.2% | |
109 | Sweden | 17.1% | |
109 | Malta | 17.1% | |
111 | Israel | 16.9% | |
111 | Bosnia and Herzegovina | 16.9% | |
113 | Philippines | 16.7% | |
114 | Switzerland | 16% | |
115 | Japan | 15.7% | |
115 | Jordan | 15.7% | |
117 | Poland | 15.4% | |
118 | Tunisia | 15.2% | |
119 | Belgium | 14.8% | |
119 | Germany | 14.8% | |
121 | Cyprus | 14.7% | |
122 | Turkey | 14.4% | |
123 | Albania | 14.3% | |
124 | Uzbekistan | 14.1% | |
125 | France | 13.6% | |
125 | Netherlands | 13.6% | |
127 | Austria | 13.3% | |
128 | Ireland | 13.1% | |
129 | Vanuatu | 12.7% | |
129 | Norway | 12.7% | |
129 | Solomon Islands | 12.7% | |
132 | Russia | 12.6% | |
133 | Denmark | 12.5% | |
134 | Australia | 12.4% | |
135 | Hungary | 12.3% | |
136 | Finland | 12.2% | |
137 | Slovenia | 12% | |
138 | Canada | 11.6% | |
139 | Mauritius | 10.3% | |
140 | Czech Republic | 10.1% | |
141 | Thailand | 9.9% | |
142 | Indonesia | 9.4% | |
143 | Uruguay | 8.8% | |
143 | Iceland | 8.8% | |
145 | Chile | 8.6% | |
146 | Bhutan | 8.2% | |
146 | Maldives | 8.2% | |
148 | Moldova | 7.3% | |
149 | Vietnam | 6.7% | |
150 | Azerbaijan | 6% | |
151 | Malaysia | 5.6% | |
152 | Algeria | 5.5% | |
153 | Belarus | 5% | |
154 | Morocco | 4.8% | |
155 | Kazakhstan | 4.3% | |
156 | Sri Lanka | 4.1% | |
157 | Ukraine | 1.1% | |
158 | United Arab Emirates | 0.796% | |
159 | China | 0.6% |
Last updated April 2, 2026
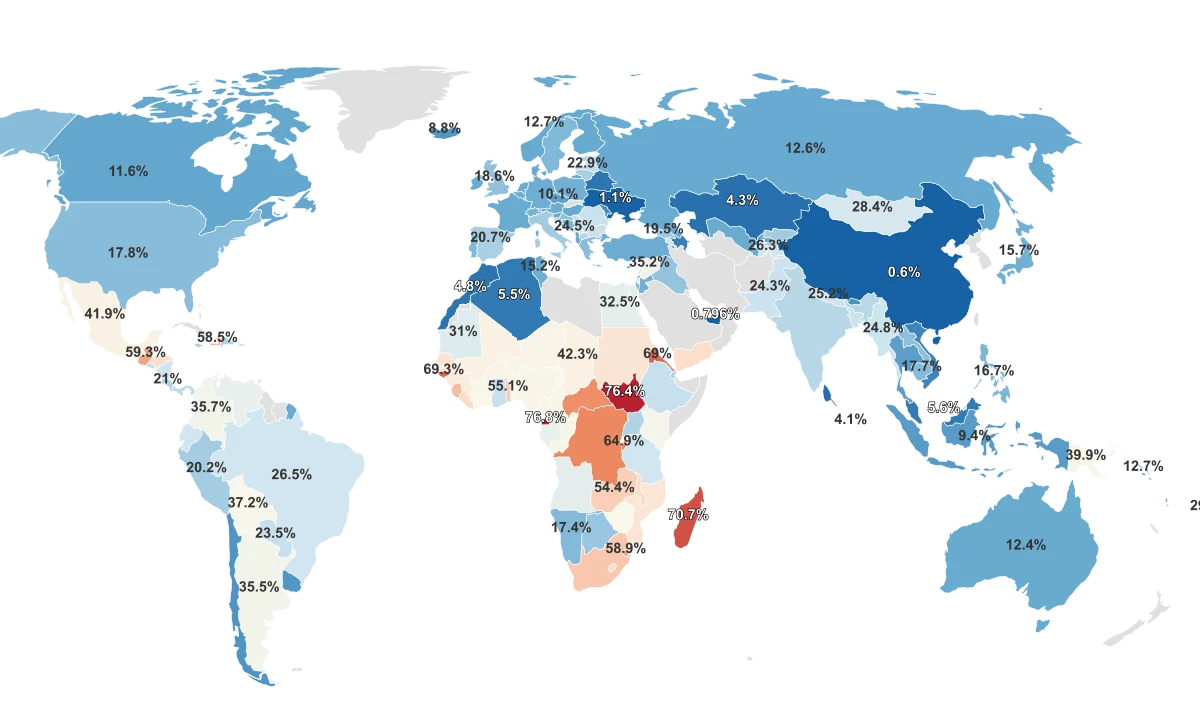
Every Country Measures Poverty Differently. That Changes the Entire Ranking.
The numbers in this ranking come from the CIA World Factbook, which reports the percentage of each country's population living below its own national poverty line. That last part is critical. Every country sets its own threshold, and those thresholds reflect wildly different standards of living. A person counted as "poor" in Luxembourg falls below roughly €2,000 per month. A person counted as "poor" in South Sudan cannot afford basic caloric intake.
The result is 159 countries measured against 159 different yardsticks. Equatorial Guinea leads the ranking at 76.8%, meaning more than three in four people live below the national poverty line. South Sudan sits just behind at 76.4%. At the other end, China reports 0.6% and Ukraine 1.1%. The full range spans 76.2 percentage points, a gap so wide that the numbers at each extreme describe fundamentally different realities.
The average poverty rate across the dataset is 27.09%, but the median is lower at 22.5%. That gap signals a top-heavy distribution: most countries cluster below 25%, but a handful of outliers in Sub-Saharan Africa pull the average upward. Nine of the ten countries above 60% poverty are in Central or West Africa.
Because every country defines poverty on its own terms, this ranking is better read as a map of how much of each country's population its own government considers poor, not as a direct comparison of living standards. The World Bank maintains separate international poverty lines ($3.00/day for extreme poverty, adjusted for purchasing power) precisely because national lines are not designed for cross-country comparison. That distinction matters more here than in almost any other ranking.
All Metrics
The Richest Countries Are Not the Least Poor
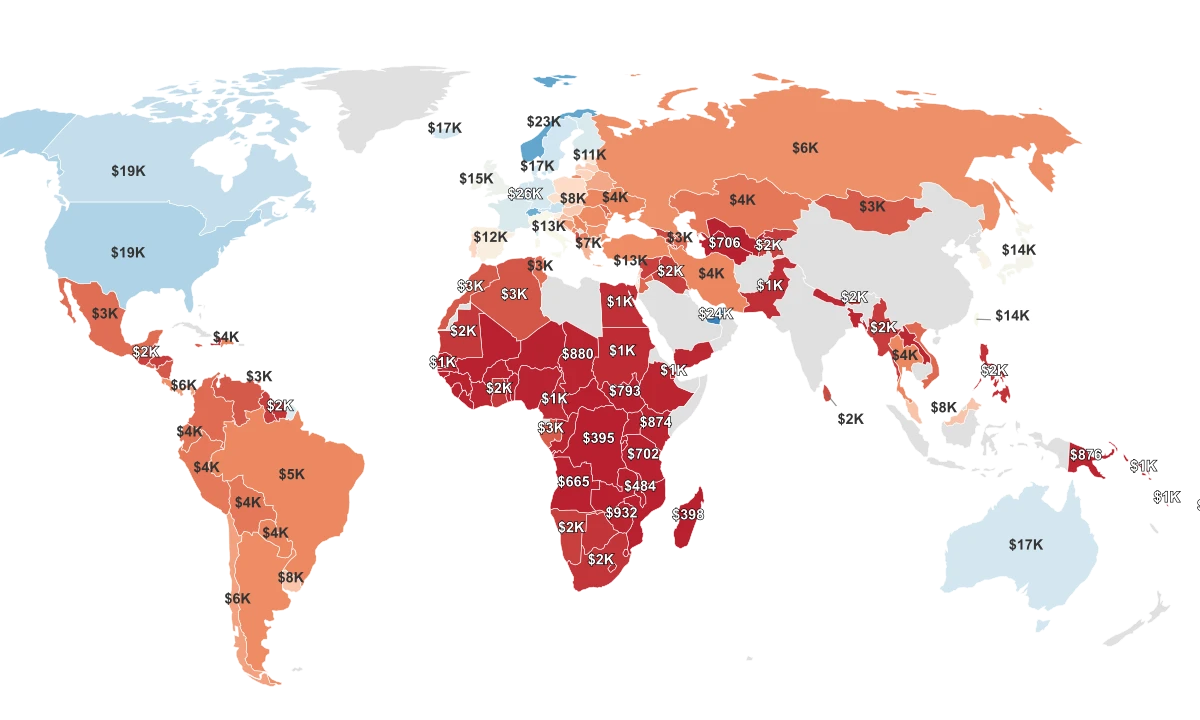
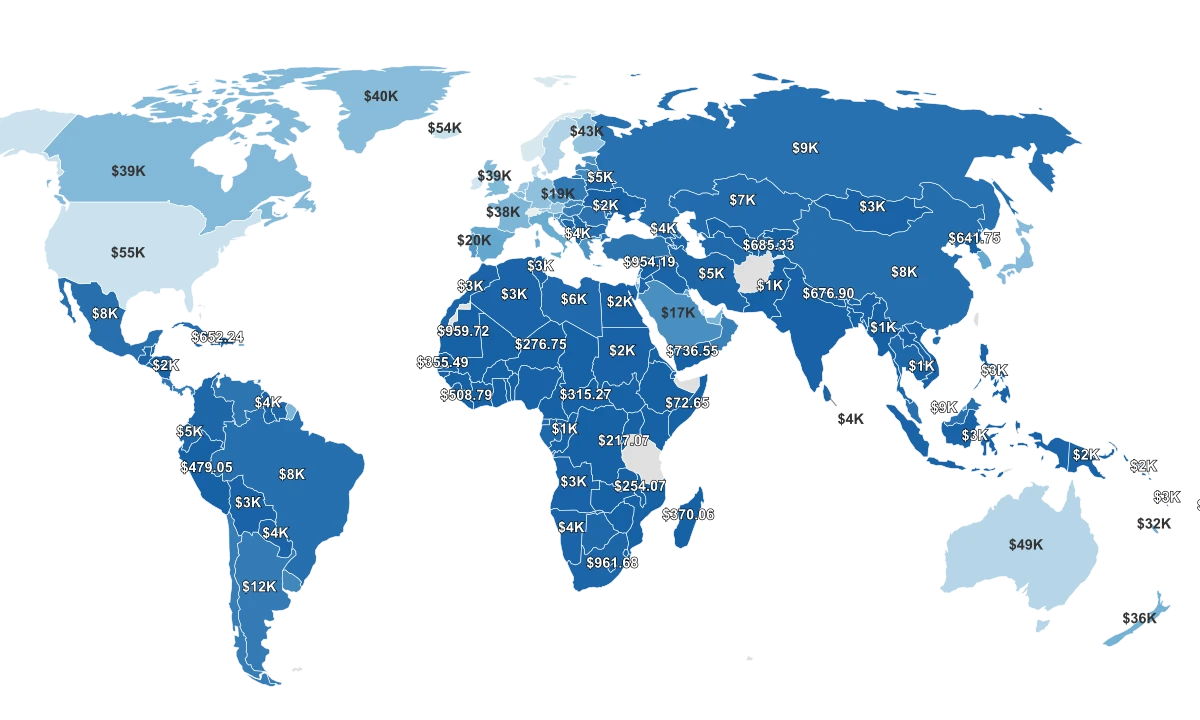
The intuitive assumption is straightforward: richer countries should have less poverty. The data says otherwise. The correlation between national poverty rates and GDP per capita (PPP) across 158 countries is only moderate, far weaker than most people would guess.
Luxembourg produces $139,466 per person annually, the second-highest GDP per capita in the dataset. Its poverty rate is 17.5%. Switzerland ($89,546 GDP per capita) reports 16.0%. The United States ($82,769) reports 17.8%. These are among the wealthiest nations on Earth, yet their poverty figures sit alongside countries with a fraction of their economic output.
National Wealth Does Not Eliminate National Poverty
Poverty Rate vs. GDP Per Capita PPP across 158 countries. The wide scatter shows that economic output alone is a poor predictor of how many people a country considers poor.
The explanation is definitional. Wealthy countries generally measure poverty relative to their own median incomes. If the threshold is 50% or 60% of what a typical household earns, then poverty rates will remain elevated as long as income inequality persists, regardless of how high the overall GDP climbs. A 2024 analysis by the Luxembourg Institute of Socio-Economic Research (LISER) found that Luxembourg's median income has risen faster than its bottom-quartile income, pushing the relative poverty rate upward even as absolute living standards improved.
Meanwhile, Vietnam produces just $14,974 per person and reports a poverty rate of 6.7%. Kazakhstan ($38,515) reports 4.3%. Ukraine ($17,630) reports 1.1%. These countries use absolute poverty thresholds tied to the cost of basic goods, which means nearly everyone above subsistence clears the bar. The ranking is not comparing apples to oranges. It is comparing apples to geometry.
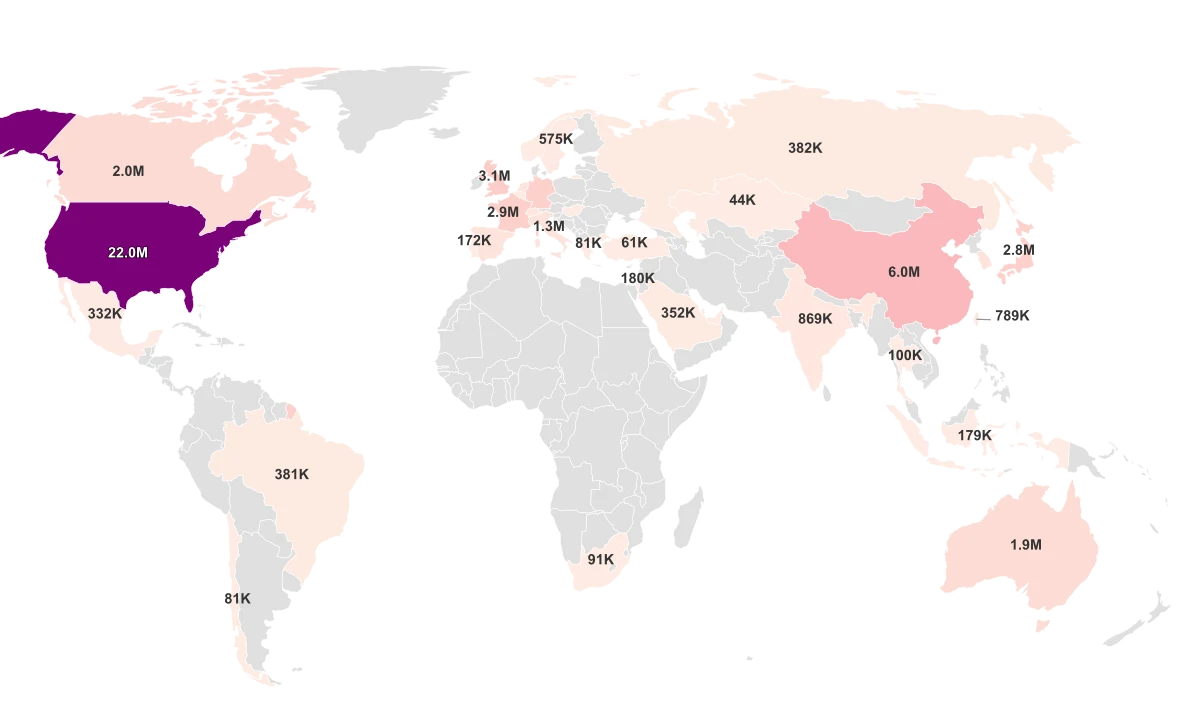
Oil Made Equatorial Guinea Rich on Paper. Most of Its People Never Noticed.
Equatorial Guinea is one of the smallest countries in Africa, with roughly 1.7 million people. Since the discovery of major offshore oil reserves in the 1990s, its GDP per capita has grown to $17,412, placing it above Vietnam, India, and dozens of other nations. Yet 76.8% of its population lives below the national poverty line, the highest rate in this entire dataset.
The disconnect is a textbook case of the resource curse. Oil extraction is capital-intensive and employs relatively few local workers. Revenue flows to the government, and a 2017 Human Rights Watch investigation documented how the ruling Obiang family has diverted a significant share of oil proceeds into personal accounts, foreign real estate, and luxury assets. Only a small fraction of the national budget has historically gone to health and education.
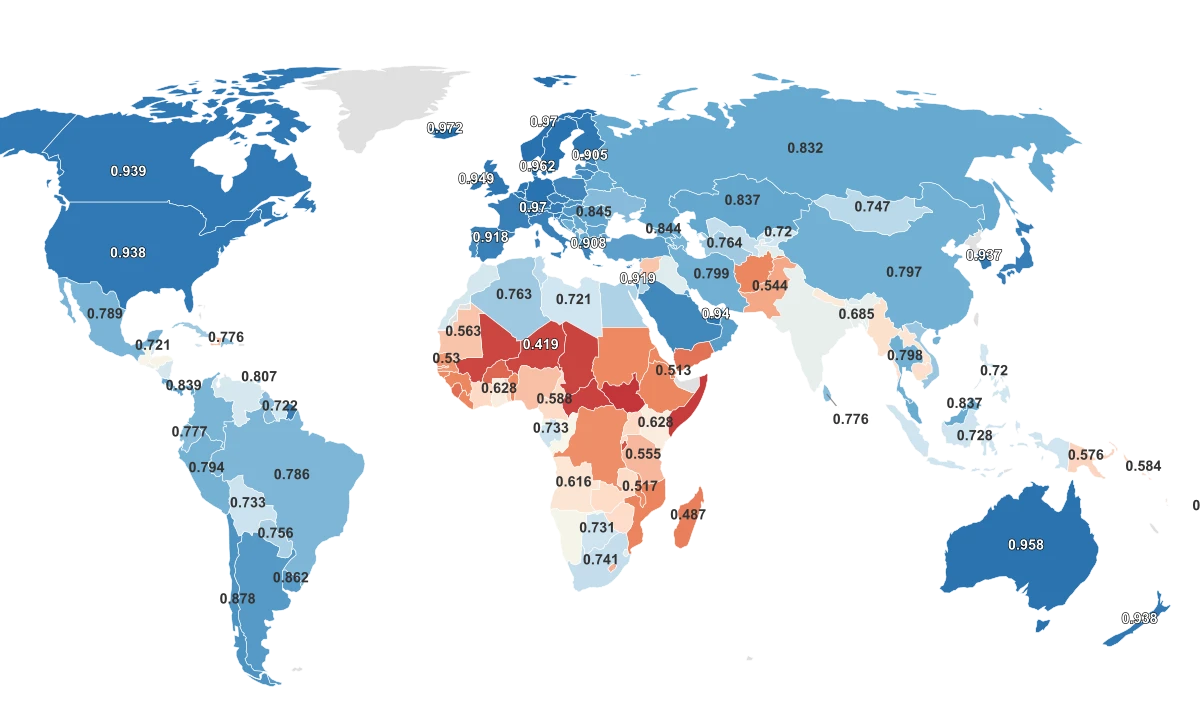
South Sudan (76.4% poverty, $1,155 GDP per capita) tells a different but equally devastating story. The world's youngest country has spent most of its independence since 2011 in civil conflict, with an HDI of just 0.388, the lowest in the entire dataset. Madagascar (70.7%) and Guinea-Bissau (69.3%) round out the most extreme cases, both shaped by chronic political instability and weak state infrastructure.
What these countries share is not a single cause but a common pattern: institutions too fragile or too captured to translate any available wealth into broad public benefit. National poverty rates above 60% are not just statistics. They describe societies where the majority of the population lacks reliable access to food, clean water, or basic healthcare, regardless of what the country's GDP suggests.
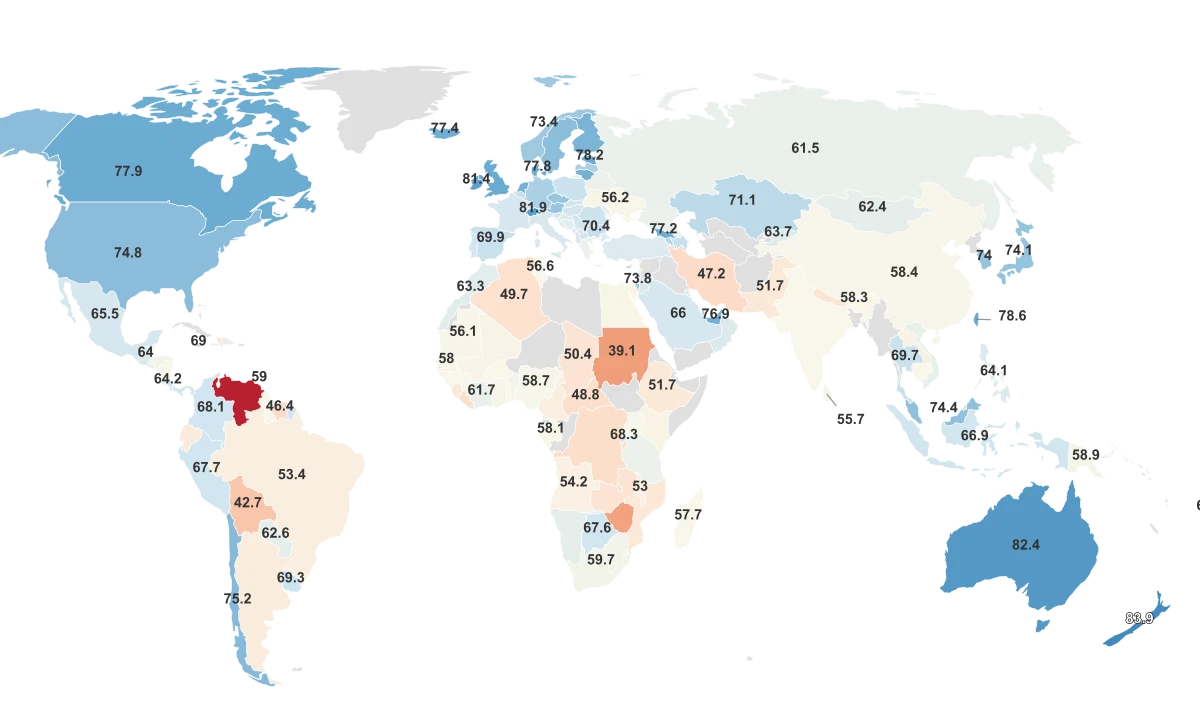
Inequality Predicts Poverty Better Than Wealth Does
If GDP is a surprisingly weak predictor of poverty, income inequality offers a somewhat clearer signal. The correlation between poverty rates and the Gini Index across 150 countries is moderately positive: countries that distribute income more unequally tend to report higher poverty.
South Africa is the most extreme example in the dataset. It has a Gini Index of 63, the highest of any country measured, and a poverty rate of 55.5%. South Africa is not a poor country by Sub-Saharan standards. Its GDP per capita ($15,194) places it above the regional average, and it has Africa's most industrialized economy. But the structural legacy of apartheid created a deeply divided labor market. Youth unemployment exceeds 50%, and a 2022 World Bank report described the economy as "dualistic": a sophisticated modern sector coexists with an underdeveloped informal economy that the majority of the population depends on.
The pattern extends across southern Africa. Namibia (Gini 59.1, poverty 17.4%) and Eswatini (Gini 54.6, poverty 58.9%) bracket the range: two of the most unequal countries on the continent with dramatically different poverty outcomes, largely depending on how narrowly or broadly their national thresholds are drawn.
The same dynamic appears in Latin America. Brazil (Gini 52, poverty 26.5%) and Colombia (Gini 54.8, poverty 35.7%) are upper-middle-income economies where wide inequality keeps poverty rates elevated even as the overall economy grows.
At the other end of the inequality spectrum, the pattern flips. Slovakia has the most equal income distribution in the dataset (Gini 24.1) and does not appear in the poverty data at all. Kazakhstan (Gini 29.2) reports just 4.3% poverty. Czech Republic (Gini 26.2) reports 10.1%. These are not the world's richest countries. They are countries where modest wealth is distributed widely enough that relatively few people fall below even their own national thresholds.
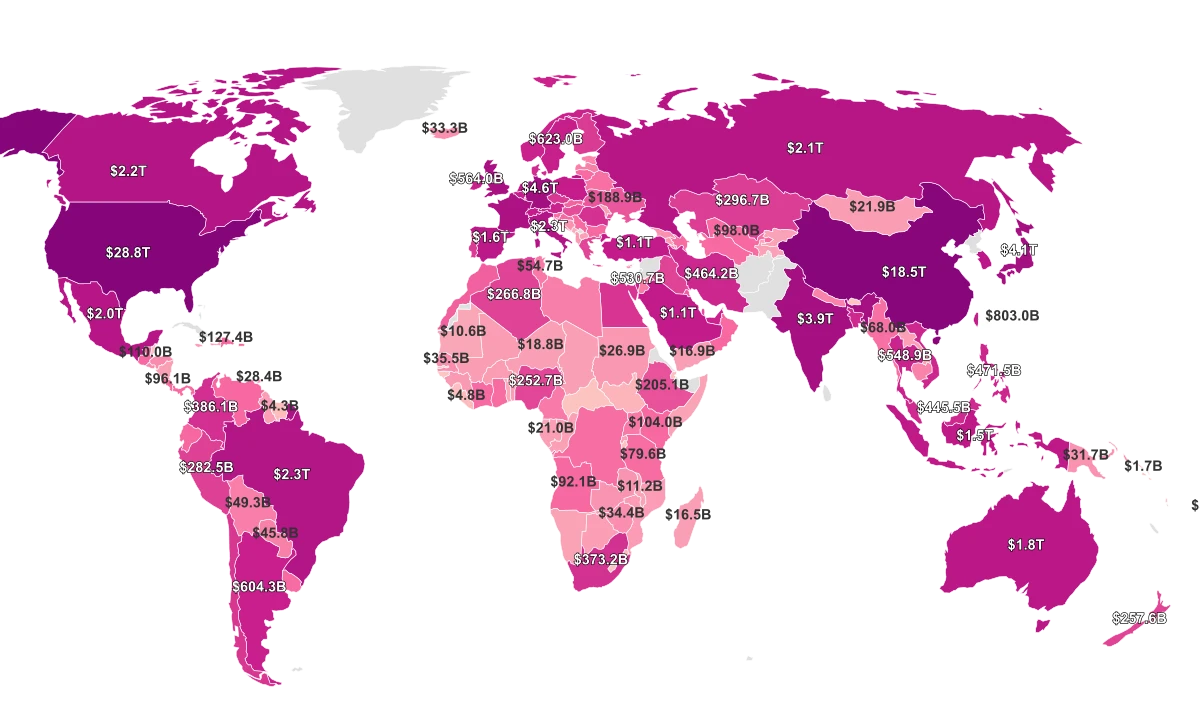
China and Vietnam Wrote the Playbook for Poverty Reduction
No country in this dataset has a lower reported poverty rate than China at 0.6%. For context, China's GDP per capita ($24,569) is roughly one-third of the United States' and one-sixth of Luxembourg's. The difference is not wealth. It is what happened over the past four decades.
China's "Reform and Opening-up" policy, launched in 1978, dismantled collective farming, opened the economy to foreign investment, and built an export-driven industrial base that pulled roughly 800 million people out of poverty. The UNDP has called it the largest poverty reduction in human history. In the later stages, the government shifted to "Targeted Poverty Alleviation," identifying the poorest households individually and tailoring interventions to each one.
Vietnam followed a parallel track. Its "Đổi Mới" reforms in 1986 transitioned the economy from central planning to a market-oriented system, prioritized agricultural reform, and invited foreign direct investment. The result: poverty fell from over 50% in the early 1990s to 6.7% in the latest data. Vietnam's HDI has climbed 58.92% since 1990, one of the fastest improvements in the entire dataset.
The contrast with countries at the top of this ranking is instructive. Guatemala (59.3% poverty) has a higher GDP per capita ($13,750) than Vietnam but has not undergone comparable structural reform. Nigeria (40.1% poverty) produces $6,207 per person, more than many countries that have reduced poverty faster. What separates the success stories from the stalled ones is not starting wealth but whether reforms reached the rural poor, whether institutions channeled growth broadly, and whether governments treated poverty reduction as a policy priority rather than an expected byproduct of growth.
Sources & Notes
% of the population living below the national poverty line.
Economic output per person adjusted for cost of living differences.
Statistical measure of income distribution inequality.
Measure of overall human development combining life expectancy, education, and income levels.