Largest Economies in the World

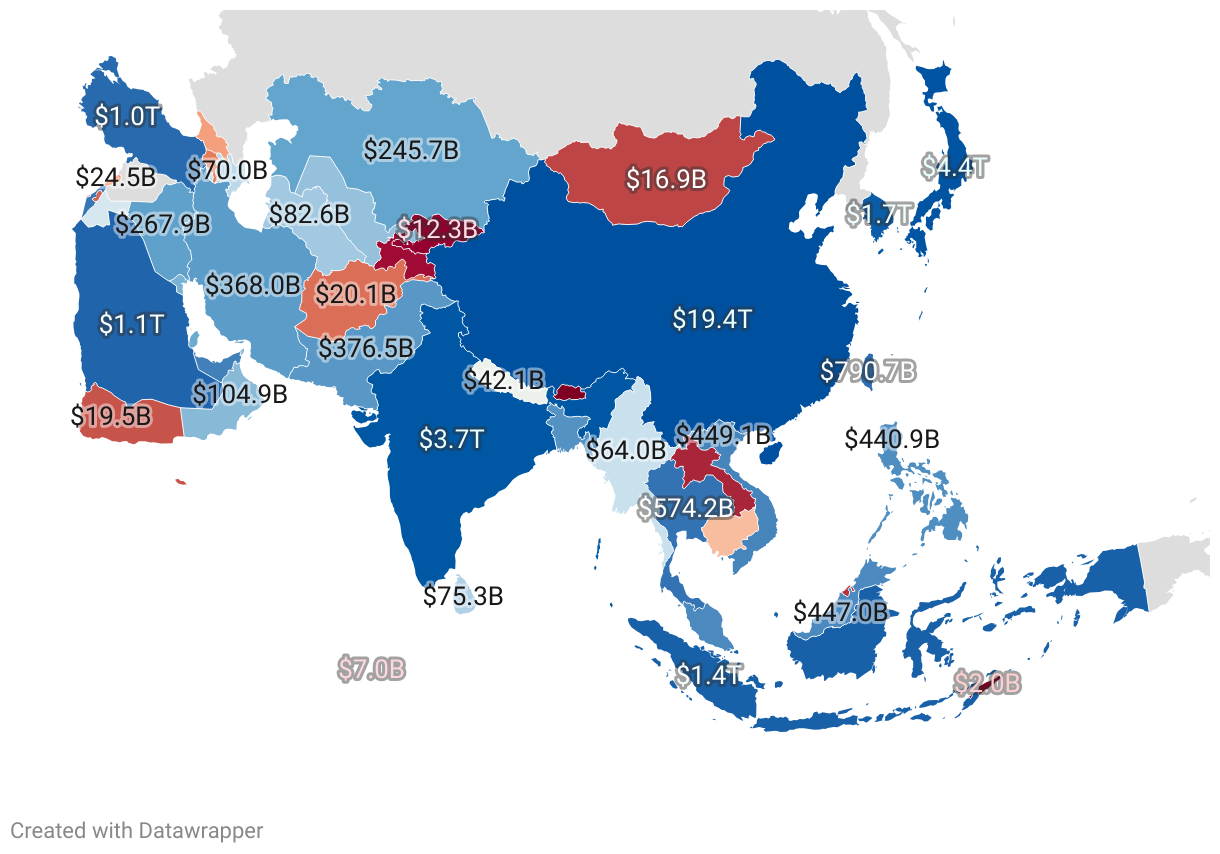
1 |  | United States | $28.78T |
2 |  | China | $18.53T |
3 |  | Germany | $4.59T |
4 |  | Japan | $4.11T |
5 |  | India | $3.94T |
6 |  | United Kingdom | $3.50T |
7 |  | France | $3.13T |
8 |  | Italy | $2.33T |
8 |  | Brazil | $2.33T |
10 |  | Canada | $2.24T |
11 |  | Russia | $2.06T |
12 |  | Mexico | $2.02T |
13 |  | Australia | $1.79T |
14 |  | South Korea | $1.76T |
15 |  | Spain | $1.65T |
16 |  | Indonesia | $1.48T |
17 |  | Netherlands | $1.14T |
18 |  | Turkey | $1.11T |
18 |  | Saudi Arabia | $1.11T |
20 |  | Switzerland | $938.46B |
21 |  | Poland | $844.62B |
22 |  | Taiwan | $802.96B |
23 |  | Belgium | $655.19B |
24 |  | Sweden | $623.05B |
25 |  | Argentina | $604.26B |
26 |  | Ireland | $564.02B |
27 |  | Thailand | $548.89B |
28 |  | Austria | $540.89B |
29 |  | Israel | $530.66B |
30 |  | United Arab Emirates | $527.80B |
31 |  | Norway | $526.95B |
32 |  | Singapore | $525.23B |
33 |  | Philippines | $471.52B |
34 |  | Vietnam | $465.81B |
35 |  | Iran | $464.18B |
36 |  | Bangladesh | $455.16B |
37 |  | Malaysia | $445.52B |
38 |  | Denmark | $409.99B |
39 |  | Hong Kong | $406.77B |
40 |  | Colombia | $386.08B |
41 |  | South Africa | $373.23B |
42 |  | Romania | $369.97B |
43 |  | Egypt | $347.59B |
44 |  | Chile | $333.76B |
45 |  | Czech Republic | $325.88B |
46 |  | Finland | $308.06B |
47 |  | Portugal | $298.95B |
48 |  | Kazakhstan | $296.74B |
49 |  | Peru | $282.46B |
50 |  | Algeria | $266.78B |
51 |  | Iraq | $265.89B |
52 |  | New Zealand | $257.63B |
53 |  | Nigeria | $252.74B |
54 |  | Greece | $250.28B |
55 |  | Qatar | $244.69B |
56 |  | Hungary | $223.41B |
57 |  | Ethiopia | $205.13B |
58 |  | Ukraine | $188.94B |
59 |  | Kuwait | $160.40B |
60 |  | Morocco | $152.38B |
61 |  | Slovakia | $140.81B |
62 |  | Dominican Republic | $127.36B |
63 |  | Ecuador | $121.59B |
64 |  | Puerto Rico | $117.76B |
65 |  | Guatemala | $110.03B |
66 |  | Oman | $108.93B |
67 |  | Bulgaria | $107.93B |
68 |  | Kenya | $104B |
69 |  | Venezuela | $102.33B |
70 |  | Uzbekistan | $97.96B |
71 |  | Costa Rica | $96.06B |
72 |  | Angola | $92.12B |
73 |  | Luxembourg | $88.56B |
74 |  | Croatia | $88.08B |
75 |  | Panama | $87.35B |
76 |  | Ivory Coast | $86.91B |
77 |  | Uruguay | $82.61B |
78 |  | Turkmenistan | $81.90B |
79 |  | Serbia | $81.87B |
80 |  | Lithuania | $81.17B |
81 |  | Tanzania | $79.61B |
82 |  | Azerbaijan | $78.75B |
83 |  | Ghana | $75.24B |
84 |  | DR Congo | $73.76B |
85 |  | Slovenia | $72.10B |
86 |  | Belarus | $69.05B |
87 |  | Myanmar | $68.01B |
88 |  | Uganda | $56.31B |
89 |  | Tunisia | $54.71B |
90 |  | Macau | $54.68B |
91 |  | Jordan | $53.57B |
92 |  | Cameroon | $53.20B |
93 |  | Bolivia | $49.33B |
94 |  | Libya | $48.22B |
95 |  | Bahrain | $46.79B |
96 |  | Paraguay | $45.82B |
97 |  | Latvia | $45.47B |
98 |  | Cambodia | $45.15B |
99 |  | Nepal | $44.18B |
100 |  | Estonia | $43.49B |
101 |  | Honduras | $37.35B |
102 |  | Senegal | $35.45B |
103 |  | El Salvador | $35.33B |
104 |  | Zimbabwe | $34.41B |
105 |  | Cyprus | $34.22B |
106 |  | Iceland | $33.34B |
107 |  | Georgia | $32.87B |
108 |  | Papua New Guinea | $31.72B |
109 |  | Zambia | $29.87B |
110 |  | Bosnia and Herzegovina | $29.08B |
111 |  | Trinidad and Tobago | $28.36B |
112 |  | Sudan | $26.86B |
113 |  | Guinea | $25.45B |
114 |  | Albania | $25.43B |
115 |  | Armenia | $25.41B |
116 |  | Haiti | $24.05B |
117 |  | Mozambique | $22.98B |
118 |  | Malta | $22.74B |
119 |  | Mongolia | $21.94B |
120 |  | Burkina Faso | $21.90B |
121 |  | Mali | $21.66B |
122 |  | Botswana | $21.42B |
123 |  | Benin | $21.37B |
124 |  | Guyana | $21.18B |
125 |  | Gabon | $21.01B |
126 |  | Jamaica | $20.10B |
127 |  | Nicaragua | $18.83B |
128 |  | Niger | $18.82B |
129 |  | Chad | $18.70B |
130 |  | Moldova | $18.36B |
131 |  | Yemen | $16.94B |
132 |  | Madagascar | $16.46B |
133 |  | Mauritius | $16.36B |
134 |  | North Macedonia | $15.87B |
135 |  | Brunei | $15.51B |
136 |  | Republic of the Congo | $15.50B |
137 |  | Laos | $15.19B |
138 |  | Bahamas | $14.39B |
139 |  | Rwanda | $13.70B |
140 |  | Kyrgyzstan | $13.60B |
141 |  | Tajikistan | $12.95B |
142 |  | Somalia | $12.80B |
143 |  | Namibia | $12.77B |
144 |  | Malawi | $11.24B |
145 |  | Equatorial Guinea | $10.71B |
146 |  | Mauritania | $10.63B |
147 |  | Togo | $9.83B |
148 |  | Montenegro | $8.01B |
149 |  | Maldives | $7.20B |
150 |  | Barbados | $6.86B |
151 |  | South Sudan | $6.52B |
152 |  | Fiji | $5.80B |
153 |  | Eswatini | $5.08B |
154 |  | Liberia | $4.75B |
155 |  | Sierra Leone | $4.56B |
156 |  | Djibouti | $4.36B |
157 |  | Suriname | $4.34B |
158 |  | Aruba | $4.07B |
159 |  | Andorra | $3.90B |
160 |  | Belize | $3.30B |
161 |  | Bhutan | $3.11B |
162 |  | Burundi | $3.08B |
163 |  | Central African Republic | $2.81B |
164 |  | Cape Verde | $2.72B |
165 |  | Gambia | $2.69B |
166 |  | Saint Lucia | $2.58B |
167 |  | Lesotho | $2.40B |
168 |  | Seychelles | $2.20B |
169 |  | Guinea Bissau | $2.15B |
170 |  | Antigua and Barbuda | $2.13B |
171 |  | San Marino | $2.03B |
172 | | Antigua and Barbuda | $1.99B |
173 |  | Solomon Islands | $1.71B |
174 |  | Comoros | $1.42B |
175 |  | Grenada | $1.41B |
176 |  | Vanuatu | $1.29B |
177 |  | Saint Kitts and Nevis | $1.13B |
177 |  | Saint Vincent and the Grenadines | $1.13B |
179 |  | Samoa | $1.02B |
180 |  | Sao Tome and Principe | $751M |
181 |  | Dominica | $708M |
182 |  | Tonga | $581M |
183 |  | Micronesia | $484M |
184 |  | Kiribati | $311M |
185 |  | Palau | $308M |
186 |  | Marshall Islands | $305M |
187 |  | Nauru | $161M |
188 |  | Tuvalu | $66,000,000 |
Last updated June 25, 2026
Key Takeaways
- The United States is the world's largest economy at $28.78 trillion, ahead of China at $18.53 trillion.
- The smallest tracked economy, Tuvalu, produces about $66 million a year, a rounding error next to the leaders.
- The top five economies together account for roughly 55% of all global output, and the US alone makes up about a quarter.
- Size and wealth split apart fast: China ranks 2nd in total output but only 83rd in income per person.
All Metrics
America and China Sit in a League of Their Own
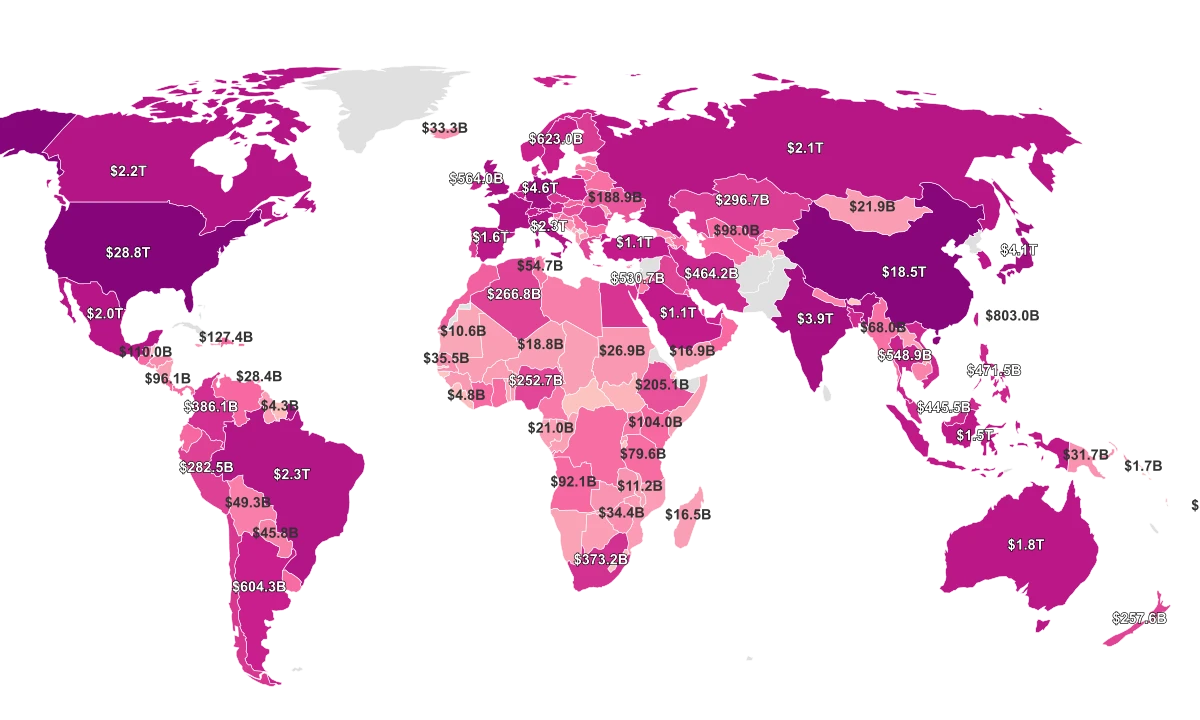
The United States is the largest economy on Earth at $28.78 trillion, with China second at $18.53 trillion. At the other end of the ranking, the smallest economy, Tuvalu, produces about $66 million a year. The figures come from the International Monetary Fund's World Economic Outlook Database, April 2024, which measures gross domestic product at current prices in US dollars, the standard yardstick for the total size of an economy.
A higher number here means a bigger economy, not a richer population or a better-run government. The IMF's methodology notes make clear this is nominal output, the dollar value of everything a country produces in a year, before any adjustment for what those dollars buy at home. Read top to bottom, the table runs across 188 economies, from a continental superpower to island nations whose annual output would not cover a mid-size company's revenue.
| Rank | Country | GDP (2024) |
|---|---|---|
| 1 | United States | $28.78T |
| 2 | China | $18.53T |
| 3 | Germany | $4.59T |
| 4 | Japan | $4.11T |
| 5 | India | $3.94T |
| 6 | United Kingdom | $3.50T |
| 7 | France | $3.13T |
| 8 | Italy | $2.33T |
Five Countries, Half the World Economy
Most rankings flatten out as you move down the list. This one falls off a cliff. The United States and China are the only two economies that stand far above the rest, and the drop after them is steep: third-place Germany, at $4.59 trillion, is barely a sixth the size of the American economy. The US alone is about 6.3 times the size of Germany, the next-largest Western economy.
That lopsidedness shows up in the totals. The world produces roughly $109 trillion in output, and a single country, the United States, accounts for about 26% of it. Add China and the two together reach close to 43%, more than two of every five dollars generated anywhere on the planet.
Widen the circle only slightly and the concentration becomes the whole story. The five largest economies, the US, China, Germany, Japan, and India, together hold about 55% of all global output. The remaining 183 economies in the ranking split what is left. According to the CSIS ChinaPower project, China's rise to that second-place perch was built over decades of rapid growth across a population of 1.4 billion, a reminder that scale, more than anything, is what lifts a country to the top of this table.
Big Economy, Not Rich Country
The most common mistake readers make with this ranking is to read "largest economy" as "richest country." The data does not support that. Across the world's economies, how rich a country's citizens are explains only about 4% of where it lands on total GDP. Size is driven by scale, not by living standards.
The split is sharpest exactly where the economies are biggest. China ranks second in total output, yet falls to 83rd in income per person, at about $24,569 on a purchasing-power basis. India tells the same story: the fifth-largest economy overall drops to 134th on the same measure, near $10,166 per person. Both are giants for the same reason: enormous output spread across enormous populations. As Our World in Data puts it, GDP per capita is simply a country's output divided by its population, an average that thins out quickly when hundreds of millions of people share it.
Flip the comparison and the point lands from the other side. Singapore is only the 32nd-largest economy in the ranking, but it has the highest GDP per capita of any economy measured, around $141,554, dwarfing far bigger countries. The World Bank's per-capita series is the standard way to separate size from prosperity, and the gap it reveals is wide. The scatter below makes the disconnect visible: there is almost no line to draw between how big an economy is and how well its average resident lives.
The Biggest Economies Are Not the Richest Per Person
Total GDP plotted against income per person, where the United States is the rare country that sits near the top on both.
Sources & Notes
Total value of all goods and services produced within a country.
Economic output per person adjusted for cost of living differences.
Middle income value, dividing income distribution into two equal groups.
Statistical measure of income distribution inequality.