HDI By Country


1▲2 | Iceland | 0.972+0.013 (+1.4%) | |
2▼1 | Switzerland | 0.97+0.003 (+0.3%) | |
2— | Norway | 0.97+0.004 (+0.4%) | |
4▲1 | Denmark | 0.962+0.01 (+1.1%) | |
5— | Sweden | 0.959+0.007 (+0.7%) | |
5▲2 | Germany | 0.959+0.009 (+0.9%) | |
7▲3 | Australia | 0.958+0.012 (+1.3%) | |
8▲2 | Netherlands | 0.955+0.009 (+1.0%) | |
9▲3 | Belgium | 0.951+0.009 (+1.0%) | |
10▼3 | Ireland | 0.949-0.001 (-0.1%) | |
11▲1 | Finland | 0.948+0.006 (+0.6%) | |
12▼3 | Singapore | 0.946-0.003 (-0.3%) | |
12▲3 | United Kingdom | 0.946+0.006 (+0.6%) | |
14▲3 | United Arab Emirates | 0.94+0.003 (+0.3%) | |
15▲3 | Canada | 0.939+0.004 (+0.4%) | |
16— | New Zealand | 0.938-0.001 (-0.1%) | |
16▼4 | Liechtenstein | 0.938-0.004 (-0.4%) | |
16▲4 | United States | 0.938+0.011 (+1.2%) | |
19— | South Korea | 0.937+0.008 (+0.9%) | |
20▲2 | Slovenia | 0.931+0.005 (+0.5%) | |
21▲1 | Austria | 0.93+0.004 (+0.4%) | |
22▲2 | Japan | 0.925+0.005 (+0.5%) | |
23▲2 | Malta | 0.924+0.009 (+1.0%) | |
24▼4 | Luxembourg | 0.922-0.005 (-0.5%) | |
25▲3 | France | 0.92+0.01 (+1.1%) | |
26▼1 | Israel | 0.919+0.004 (+0.4%) | |
27— | Spain | 0.918+0.007 (+0.8%) | |
28▲2 | Italy | 0.915+0.009 (+1.0%) | |
28▲15 | San Marino | 0.915+0.048 (+5.5%) | |
28▲4 | Czech Republic | 0.915+0.02 (+2.2%) | |
31▲4 | Andorra | 0.913+0.029 (+3.3%) | |
31▼2 | Cyprus | 0.913+0.006 (+0.7%) | |
33— | Greece | 0.908+0.015 (+1.7%) | |
34▲2 | Poland | 0.906+0.025 (+2.8%) | |
35▼4 | Estonia | 0.905+0.006 (+0.7%) | |
36▲4 | Saudi Arabia | 0.9+0.025 (+2.9%) | |
37▼3 | Bahrain | 0.899+0.011 (+1.2%) | |
38▼1 | Lithuania | 0.895+0.016 (+1.8%) | |
39▲3 | Portugal | 0.89+0.016 (+1.8%) | |
40▼3 | Latvia | 0.889+0.01 (+1.1%) | |
40▼1 | Croatia | 0.889+0.011 (+1.3%) | |
42▼2 | Qatar | 0.886+0.011 (+1.3%) | |
43▲2 | Slovakia | 0.88+0.025 (+2.9%) | |
44— | Chile | 0.878+0.018 (+2.1%) | |
45▲2 | Hungary | 0.87+0.019 (+2.2%) | |
46▲2 | Argentina | 0.865+0.016 (+1.9%) | |
47▲3 | Montenegro | 0.862+0.018 (+2.1%) | |
47▲5 | Uruguay | 0.862+0.032 (+3.9%) | |
49▲10 | Oman | 0.858+0.039 (+4.8%) | |
50▼5 | Turkey | 0.853-0.002 (-0.2%) | |
51▼2 | Kuwait | 0.852+0.005 (+0.6%) | |
52▲2 | Antigua and Barbuda | 0.851+0.025 (+3.0%) | |
53▲14 | Seychelles | 0.848+0.046 (+5.7%) | |
54▼1 | Romania | 0.845+0.018 (+2.2%) | |
54▲16 | Bulgaria | 0.845+0.046 (+5.8%) | |
56▲4 | Georgia | 0.844+0.03 (+3.7%) | |
57▼6 | Saint Kitts and Nevis | 0.84+0.002 (+0.2%) | |
58▼1 | Panama | 0.839+0.019 (+2.3%) | |
59▼4 | Brunei | 0.837+0.014 (+1.7%) | |
59▲8 | Kazakhstan | 0.837+0.035 (+4.4%) | |
61▲3 | Costa Rica | 0.833+0.027 (+3.3%) | |
61▲4 | Serbia | 0.833+0.028 (+3.5%) | |
63▼7 | Russia | 0.832+0.011 (+1.3%) | |
64▲5 | Belarus | 0.824+0.023 (+2.9%) | |
65▼8 | Bahamas | 0.82 | |
66▼3 | Malaysia | 0.819+0.012 (+1.5%) | |
67▲16 | North Macedonia | 0.815+0.05 (+6.5%) | |
68▲8 | Armenia | 0.811+0.025 (+3.2%) | |
68▼6 | Barbados | 0.811+0.002 (+0.2%) | |
70▲4 | Albania | 0.81+0.021 (+2.7%) | |
71▼11 | Trinidad and Tobago | 0.807-0.007 (-0.9%) | |
72— | Mauritius | 0.806+0.01 (+1.3%) | |
73▲7 | Bosnia and Herzegovina | 0.804+0.025 (+3.2%) | |
74▲4 | Iran | 0.799+0.019 (+2.4%) | |
75▼9 | Thailand | 0.798-0.005 (-0.6%) | |
75▲6 | Saint Vincent and the Grenadines | 0.798+0.026 (+3.4%) | |
77▼2 | China | 0.797+0.009 (+1.1%) | |
78▲9 | Peru | 0.794+0.032 (+4.2%) | |
79▼6 | Grenada | 0.791-0.002 (-0.3%) | |
80▼3 | Mexico | 0.789+0.008 (+1.0%) | |
80▲9 | Azerbaijan | 0.789+0.029 (+3.8%) | |
82▲9 | Colombia | 0.788+0.03 (+4.0%) | |
83▲6 | Brazil | 0.786+0.026 (+3.4%) | |
83▼12 | Palau | 0.786-0.011 (-1.4%) | |
85▲1 | Moldova | 0.785+0.022 (+2.9%) | |
86▲14 | Ukraine | 0.779+0.045 (+6.1%) | |
87▼4 | Ecuador | 0.777+0.012 (+1.6%) | |
88▲7 | Guyana | 0.776+0.034 (+4.6%) | |
88▼6 | Dominican Republic | 0.776+0.01 (+1.3%) | |
88▼10 | Sri Lanka | 0.776-0.004 (-0.5%) | |
91▲7 | Tonga | 0.769+0.03 (+4.1%) | |
92▼5 | Maldives | 0.766+0.004 (+0.5%) | |
92▲15 | Vietnam | 0.766+0.04 (+5.5%) | |
94— | Turkmenistan | 0.764+0.02 (+2.7%) | |
95▼2 | Algeria | 0.763+0.018 (+2.4%) | |
96▼11 | Cuba | 0.762-0.002 (-0.3%) | |
97— | Dominica | 0.761+0.021 (+2.8%) | |
98▲4 | Paraguay | 0.756+0.025 (+3.4%) | |
99▲6 | Egypt | 0.754+0.026 (+3.6%) | |
99— | Jordan | 0.754+0.018 (+2.4%) | |
101▲8 | Lebanon | 0.752+0.029 (+4.0%) | |
102▲6 | Saint Lucia | 0.748+0.023 (+3.2%) | |
103▼7 | Mongolia | 0.747+0.006 (+0.8%) | |
104▼3 | Tunisia | 0.746+0.014 (+1.9%) | |
105▲5 | South Africa | 0.741+0.024 (+3.3%) | |
106— | Uzbekistan | 0.74+0.013 (+1.8%) | |
107▼5 | Marshall Islands | 0.733+0.002 (+0.3%) | |
107▲16 | Gabon | 0.733+0.04 (+5.8%) | |
107▲13 | Bolivia | 0.733+0.035 (+5.0%) | |
110▼6 | Fiji | 0.731+0.002 (+0.3%) | |
110▲4 | Botswana | 0.731+0.023 (+3.2%) | |
112— | Indonesia | 0.728+0.015 (+2.1%) | |
113▲11 | Suriname | 0.722+0.032 (+4.6%) | |
114▼22 | Libya | 0.721-0.025 (-3.4%) | |
114▲4 | Belize | 0.721+0.021 (+3.0%) | |
116▼1 | Jamaica | 0.72+0.014 (+2.0%) | |
116▲1 | Kyrgyzstan | 0.72+0.019 (+2.7%) | |
116▼3 | Philippines | 0.72+0.01 (+1.4%) | |
119▲1 | Morocco | 0.71+0.012 (+1.7%) | |
120▼1 | Venezuela | 0.709+0.01 (+1.4%) | |
121▼5 | Samoa | 0.708+0.006 (+0.9%) | |
122▲8 | Nicaragua | 0.706+0.037 (+5.5%) | |
123▼1 | Nauru | 0.703+0.007 (+1.0%) | |
124▲1 | Bhutan | 0.698+0.017 (+2.5%) | |
125▲3 | Iraq | 0.695+0.022 (+3.3%) | |
125▲17 | Eswatini | 0.695+0.085 (+14%) | |
127▼1 | Tajikistan | 0.691+0.012 (+1.8%) | |
128▲4 | Tuvalu | 0.689+0.036 (+5.5%) | |
129— | Bangladesh | 0.685+0.015 (+2.2%) | |
129▲5 | India | 0.685+0.041 (+6.4%) | |
131▼4 | El Salvador | 0.678+0.004 (+0.6%) | |
132▼21 | Palestine | 0.674-0.042 (-5.9%) | |
132▲1 | Equatorial Guinea | 0.674+0.024 (+3.7%) | |
134▼3 | Cape Verde | 0.668+0.007 (+1.1%) | |
135▲7 | Namibia | 0.665+0.055 (+9.0%) | |
136— | Guatemala | 0.662+0.033 (+5.2%) | |
137▲12 | Republic of the Congo | 0.649+0.056 (+9.4%) | |
138— | Honduras | 0.645+0.021 (+3.4%) | |
139▼2 | Kiribati | 0.644+0.016 (+2.5%) | |
140▲1 | Sao Tome and Principe | 0.637+0.024 (+3.9%) | |
141▲14 | Timor Leste | 0.634+0.068 (+12%) | |
142▲4 | Kenya | 0.628+0.027 (+4.5%) | |
142▲3 | Ghana | 0.628+0.026 (+4.3%) | |
144▲2 | Nepal | 0.622+0.021 (+3.5%) | |
145▼5 | Vanuatu | 0.621+0.007 (+1.1%) | |
146▼7 | Laos | 0.617-0.003 (-0.5%) | |
147▲3 | Angola | 0.616+0.025 (+4.2%) | |
148▼13 | Micronesia | 0.615-0.019 (-3.0%) | |
149▼5 | Myanmar | 0.609+0.001 (+0.2%) | |
150▼2 | Cambodia | 0.606+0.006 (+1.0%) | |
151▲1 | Comoros | 0.603+0.017 (+2.9%) | |
152▲7 | Zimbabwe | 0.598+0.048 (+8.7%) | |
153— | Zambia | 0.595+0.026 (+4.6%) | |
154▼3 | Cameroon | 0.588+0.001 (+0.2%) | |
155▲1 | Solomon Islands | 0.584+0.022 (+3.9%) | |
156▲3 | Uganda | 0.582+0.032 (+5.8%) | |
156▲10 | Ivory Coast | 0.582+0.048 (+9.0%) | |
158▲3 | Rwanda | 0.578+0.03 (+5.5%) | |
159▼5 | Papua New Guinea | 0.576+0.008 (+1.4%) | |
160▲3 | Togo | 0.571+0.024 (+4.4%) | |
161▼4 | Syria | 0.564+0.007 (+1.3%) | |
162▲2 | Mauritania | 0.563+0.023 (+4.3%) | |
163▼2 | Nigeria | 0.56+0.012 (+2.2%) | |
164▲3 | Tanzania | 0.555+0.023 (+4.3%) | |
165▼7 | Haiti | 0.554+0.002 (+0.4%) | |
166▲2 | Lesotho | 0.55+0.029 (+5.6%) | |
167▼3 | Pakistan | 0.544+0.004 (+0.7%) | |
168▲1 | Senegal | 0.53+0.013 (+2.5%) | |
169▲5 | Gambia | 0.524+0.029 (+5.9%) | |
170▲10 | DR Congo | 0.522+0.041 (+8.5%) | |
171▲1 | Malawi | 0.517+0.009 (+1.8%) | |
172▲1 | Benin | 0.515+0.011 (+2.2%) | |
173▲6 | Guinea Bissau | 0.514+0.031 (+6.4%) | |
174▼3 | Djibouti | 0.513-0.002 (-0.4%) | |
175▼5 | Sudan | 0.511-0.005 (-1.0%) | |
176▲1 | Liberia | 0.51+0.023 (+4.7%) | |
177▼2 | Eritrea | 0.503+0.01 (+2.0%) | |
178▲3 | Guinea | 0.5+0.029 (+6.2%) | |
179▼3 | Ethiopia | 0.497+0.005 (+1.0%) | |
180▲2 | Afghanistan | 0.496+0.034 (+7.4%) | |
181▲2 | Mozambique | 0.493+0.032 (+6.9%) | |
182▼5 | Madagascar | 0.487 | |
183▲3 | Yemen | 0.47+0.046 (+11%) | |
184— | Sierra Leone | 0.467+0.009 (+2.0%) | |
185— | Burkina Faso | 0.459+0.021 (+4.8%) | |
186▲1 | Burundi | 0.439+0.019 (+4.5%) | |
187▲1 | Mali | 0.419+0.009 (+2.2%) | |
187▲2 | Niger | 0.419+0.025 (+6.3%) | |
189— | Chad | 0.416+0.022 (+5.6%) | |
190▲1 | Central African Republic | 0.414+0.027 (+7.0%) | |
191▲2 | Somalia | 0.404+0.024 (+6.3%) | |
192— | South Sudan | 0.388+0.007 (+1.8%) |
Last updated April 1, 2026
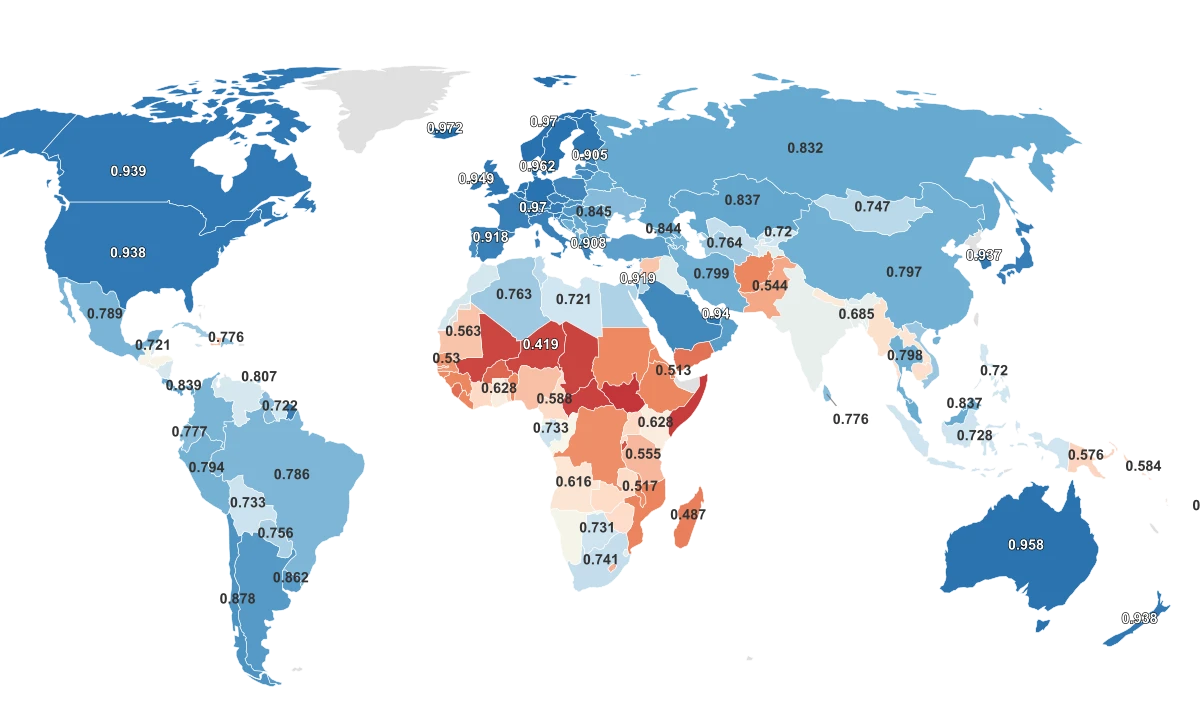
A Single Number Built From Three Dimensions of Life
The Human Development Index does something most economic rankings avoid. It ignores GDP entirely. Instead, the UNDP's flagship metric combines three questions about a country's population: how long do people live, how much education do they receive, and how much income do they earn? Each dimension is scored on a 0-to-1 scale, then combined using a geometric mean, a formula that punishes imbalance. A country that is wealthy but unhealthy cannot buy its way to the top.
In the 2023 data, Iceland leads 192 countries with a score of 0.972. Switzerland and Norway are tied at 0.970. Denmark (0.962) and Sweden (0.959) round out a Nordic cluster that dominates the top of the ranking. The top five countries sit within 0.013 points of each other, a margin so narrow it reflects shared institutional design: universal healthcare, free higher education, progressive taxation, and among the lowest income inequality on earth.
At the other end, South Sudan anchors the bottom at 0.388. Somalia (0.404) and the Central African Republic (0.414) sit just above it. The gap between Iceland and South Sudan is 0.584 points, which translates to a difference of roughly 25 years in life expectancy, 10 years of schooling, and orders-of-magnitude disparities in income.
Every country in the bottom 15 is in Sub-Saharan Africa. Chad (0.416), Niger (0.419), and Mali (0.419) round out the lowest tier. The pattern is not random. It reflects compounding deficits in health, education, and income that these nations share.
The distribution across all 192 countries is surprisingly even. The global mean sits at 0.74 and the median at 0.76. Most countries land between 0.6 and 0.9. But the bottom tier breaks sharply from the pack: the six lowest-scoring nations all fall more than two standard deviations below the mean, a statistical gap so wide it represents a fundamentally different reality of daily life.
All Metrics
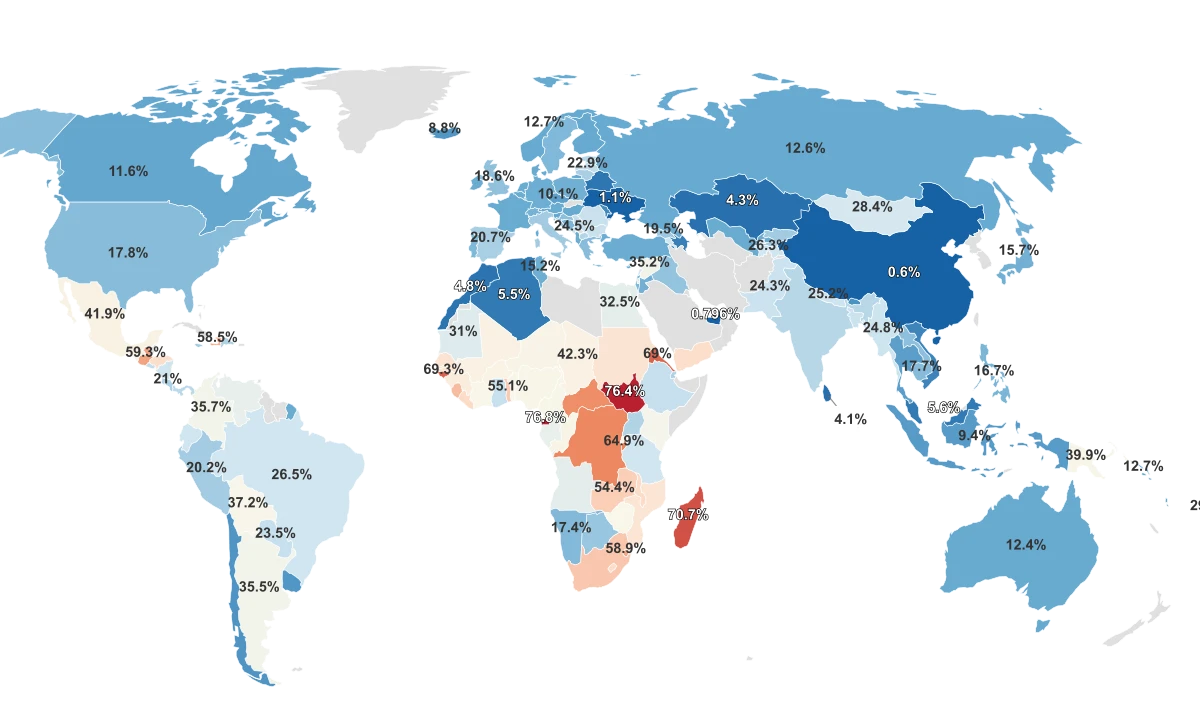
Averages Lie: What the Inequality Adjustment Reveals
The HDI measures what a country achieves on average. The Inequality-adjusted Human Development Index, or IHDI, measures what a country achieves in practice by discounting those averages based on how unevenly health, education, and income are distributed across the population. The gap between the two scores reveals something the headline ranking hides: who actually benefits from national progress.
The United States ranks 18th in HDI with a score of 0.938. Adjusted for inequality, it drops to 29th with an IHDI of 0.832, an 11.3% loss. That is the largest inequality discount among the top 20 HDI countries. The U.S. falls behind South Korea (0.857), Japan (0.845), and France (0.836), countries that rank lower on the standard HDI but distribute their development gains more evenly. According to the UNDP's 2025 Human Development Report, the American loss is driven by disparities in all three dimensions, concentrated along racial, geographic, and income lines.
Iceland loses just 5.0% when adjusted for inequality, the smallest discount in the dataset. Slovenia (4.9%) and the Czech Republic (5.2%) are close behind. These are not the richest countries in the world. They are the most equitable. The Nordic bloc as a whole loses between 5% and 6.3%, a pattern that tracks directly with their universal welfare systems and compressed income distributions.
The gap widens dramatically at the bottom. Somalia loses 43.3% of its HDI when adjusted for inequality. South Sudan loses 41.8%. Angola loses 41.6%. In these countries, national averages obscure the reality that a small urban elite may live at middle-income standards while the rural majority faces conditions that the headline number does not reflect.
The Fastest Climb and the Steepest Fall
The HDI dataset stretches back to 1990, covering 33 years of development trajectories across 142 countries. No country's story in that span is more dramatic than China's. In 1990, China scored 0.484, placing it 104th out of 142 nations. By 2023, it reached 0.797 and climbed to 77th out of 192. That 64.7% increase makes it the only country in UNDP history to transition from "low" to "high" human development. The World Bank attributes the transformation to the most rapid poverty reduction in recorded history: more than 800 million people lifted above the extreme poverty line in three decades.
Bangladesh posted the highest percentage gain: 72.5%, rising from 0.397 to 0.685. Turkey climbed 29 ranking spots, the most of any country, moving from 79th to 50th. Singapore rose 25 spots, from 37th to 12th. Ireland climbed 20 spots on the back of its economic transformation from one of Western Europe's poorest nations to one of its wealthiest.
Three Decades of Development: Who Climbed and Who Collapsed
Human Development Index scores from 1990 to 2023. China's rise and Syria's stagnation represent the dataset's two extremes.
Showing 51 of 141 regions · Sorted by: Highest to Lowest · 90 not shown
The opposite trajectory belongs to Syria. Its HDI in 1990 was 0.562. In 2023, after more than a decade of civil war, it scores 0.564. Thirty-three years and essentially no progress. In ranking terms, Syria fell 70 spots, from 91st to 161st, as the rest of the world advanced around it. According to the UNDP's Syria assessment, roughly half the country's infrastructure has been destroyed, and millions of its most educated citizens have fled.
Venezuela peaked at 0.767 in 2015, a score that placed it solidly in the "high" development tier. By 2023, it had fallen to 0.709 and dropped 60 ranking spots. The collapse was economic, not military: hyperinflation, institutional failure, and the emigration of roughly 7 million people gutted the country's human capital. Libya fell 59 spots. Yemen fell 60. In every case, the mechanism is the same: when institutions collapse, decades of development gains disappear in years.
Why the Bottom of the Index Barely Moves
Every country in the bottom six of the 2023 HDI ranking is in Sub-Saharan Africa. South Sudan (0.388), Somalia (0.404), and the Central African Republic (0.414) anchor the very bottom. Chad, Niger, and Mali all cluster at roughly 0.42. This is not a coincidence of geography. It is a consequence of compounding deficits across all three dimensions that the index measures.
Life expectancy tells part of the story. In Chad, the average person is expected to live 55.2 years. In Nigeria, 54.6. These are not outliers within the group: South Sudan and the Central African Republic both sit at 57.7.
Compare that to the top of the dataset, where Hong Kong reaches 85.6 years and Japan 84.8. The gap between Chad and Hong Kong is more than 30 years of life.
Education tells the rest. Niger has an Education Index of 0.243, the lowest in the dataset. Mali scores 0.248. Somalia scores 0.274. These numbers capture not just current school enrollment but the cumulative effect of decades of underinvestment, conflict, and the exclusion of girls from formal schooling.
At the top, Iceland scores 0.960 and Germany 0.957. The distance between Niger and Iceland on the Education Index is wider than on any other HDI component, and it reflects gaps that take generations to close.
Education Is the Strongest Predictor of Where Countries Rank
Countries with low Education Index scores cannot crack the top half of the HDI ranking, regardless of income or life expectancy.
The HDI's formula makes escaping the bottom especially difficult. Because it uses a geometric mean rather than a simple average, a severe deficit in any one dimension drags the composite score down disproportionately. A country with reasonable income but catastrophic life expectancy, or adequate health but almost no schooling, cannot compensate. South Sudan has actually moved backward: its HDI was 0.43 in 2000 and has fallen to 0.388 in 2023, erased by civil war, famine, and the displacement of roughly a third of its population. Until health, education, and income improve simultaneously, the math of the index will keep these countries pinned to the bottom.
Sources & Notes
Measure of overall human development combining life expectancy, education, and income levels.
Measure of human development combining life expectancy, education, and income levels adjusted for inequality in distribution.
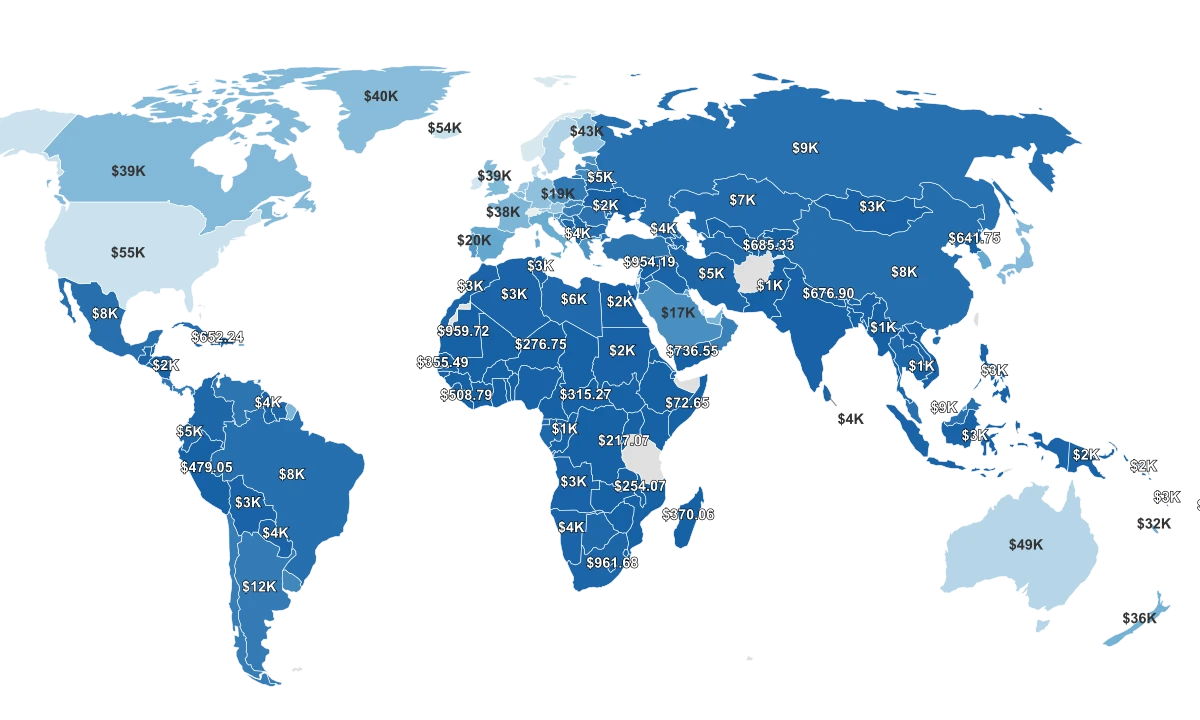
Average number of years a newborn is expected to live.
Measure of years of schooling and educational attainment levels achieved by the population.