Poorest Asian Countries

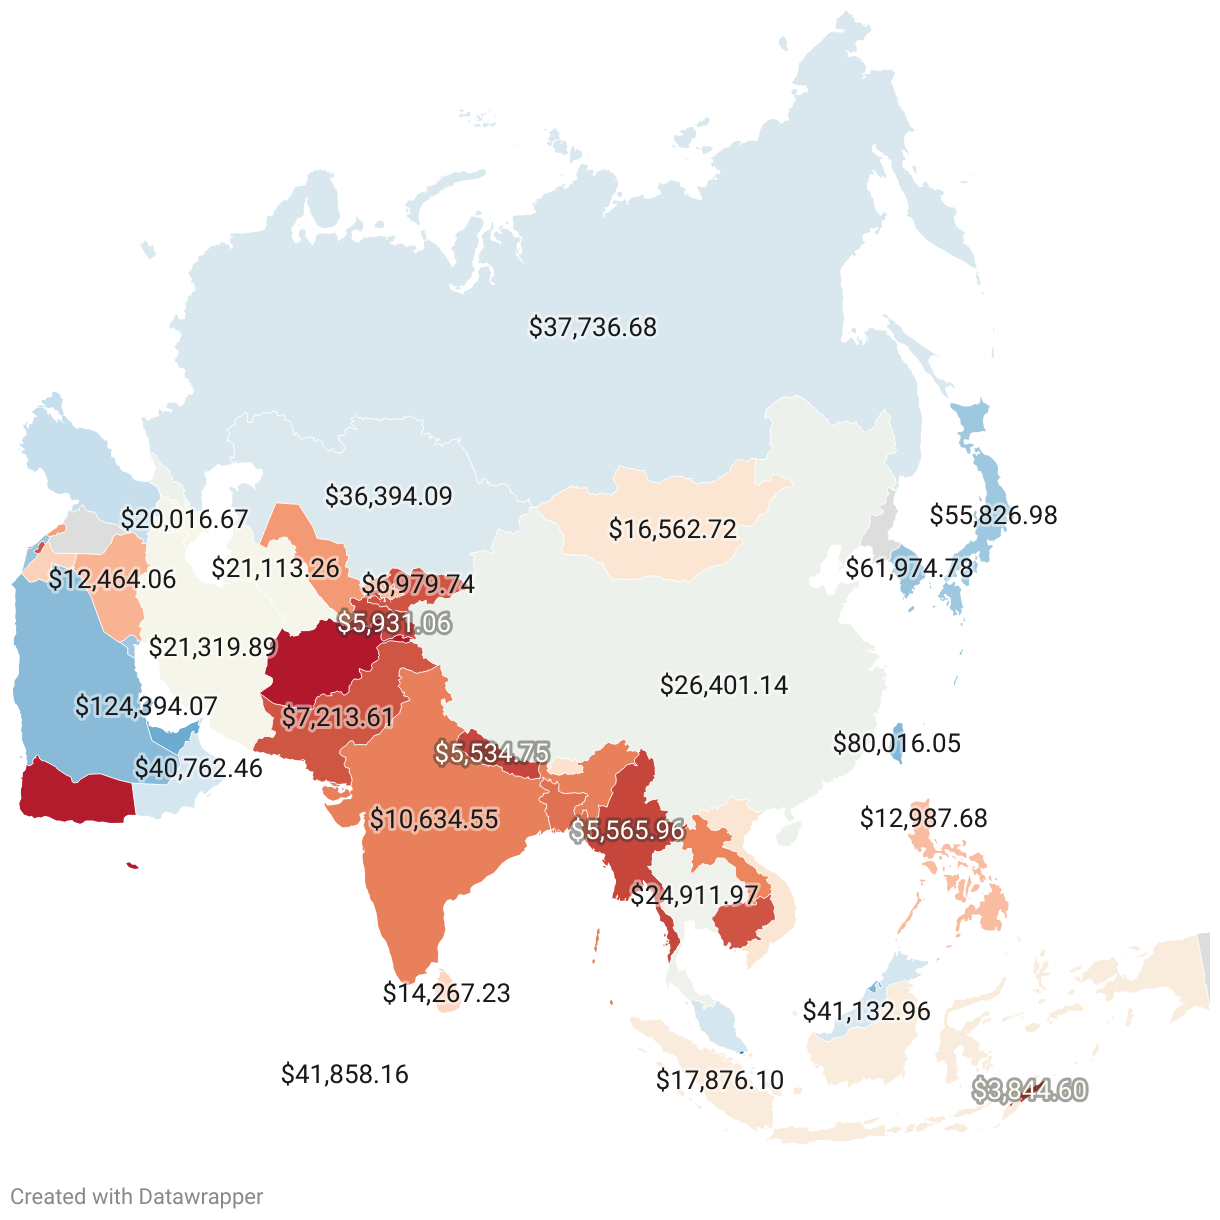
1 |  | Afghanistan | 1,990.99 |
2 |  | Yemen | 2,236.99 |
3 |  | Timor Leste | 3,844.6 |
4 |  | Nepal | 5,534.75 |
5 |  | Myanmar | 5,565.96 |
6 |  | Tajikistan | 5,931.06 |
7 |  | Palestine | 6,970.25 |
8 |  | Kyrgyzstan | 6,979.74 |
9 |  | Cambodia | 7,028.87 |
10 |  | Pakistan | 7,213.61 |
11 |  | Bangladesh | 10,188.54 |
12 |  | India | 10,634.55 |
13 |  | Laos | 10,765.24 |
14 |  | Uzbekistan | 11,512.95 |
15 |  | Lebanon | 11,793.82 |
16 |  | Iraq | 12,464.06 |
17 |  | Philippines | 12,987.68 |
18 |  | Jordan | 14,098.3 |
19 |  | Sri Lanka | 14,267.23 |
20 |  | Bhutan | 15,764.67 |
21 |  | Mongolia | 16,562.72 |
22 |  | Vietnam | 16,569.02 |
23 |  | Indonesia | 17,876.1 |
24 |  | Azerbaijan | 20,016.67 |
25 |  | Turkmenistan | 21,113.26 |
26 |  | Iran | 21,319.89 |
27 |  | Armenia | 22,599.05 |
28 |  | Thailand | 24,911.97 |
29 |  | Georgia | 25,886.35 |
30 |  | China | 26,401.14 |
31 |  | Kazakhstan | 36,394.09 |
32 |  | Russia | 37,736.68 |
33 |  | Oman | 40,762.46 |
34 |  | Malaysia | 41,132.96 |
35 |  | Maldives | 41,858.16 |
36 |  | Turkey | 45,423.97 |
37 |  | Japan | 55,826.98 |
38 |  | Kuwait | 55,963.82 |
39 |  | Israel | 58,662.9 |
40 |  | South Korea | 61,974.78 |
41 |  | Bahrain | 64,424.83 |
42 |  | Saudi Arabia | 74,394.35 |
43 |  | Hong Kong | 79,461.33 |
44 |  | Taiwan | 80,016.05 |
45 |  | Brunei | 80,633.08 |
46 |  | United Arab Emirates | 97,019.55 |
47 |  | Qatar | 124,394.07 |
48 |  | Singapore | 144,144.76 |
49 |  | Macau | 144,916.13 |
Last updated June 25, 2026
Key Takeaways
- Afghanistan reports the lowest income per person in Asia, at about $1,991 a year in purchasing-power terms.
- Macau sits at the top of the same continent, at roughly $144,916 per person.
- That puts the richest place in Asia about 73 times above the poorest, the widest gap in the dataset.
- The ranking measures income per person, not the size of a country, so a large economy can still sit near the bottom.
What 'Poorest' Measures When the Yardstick Is Income Per Person
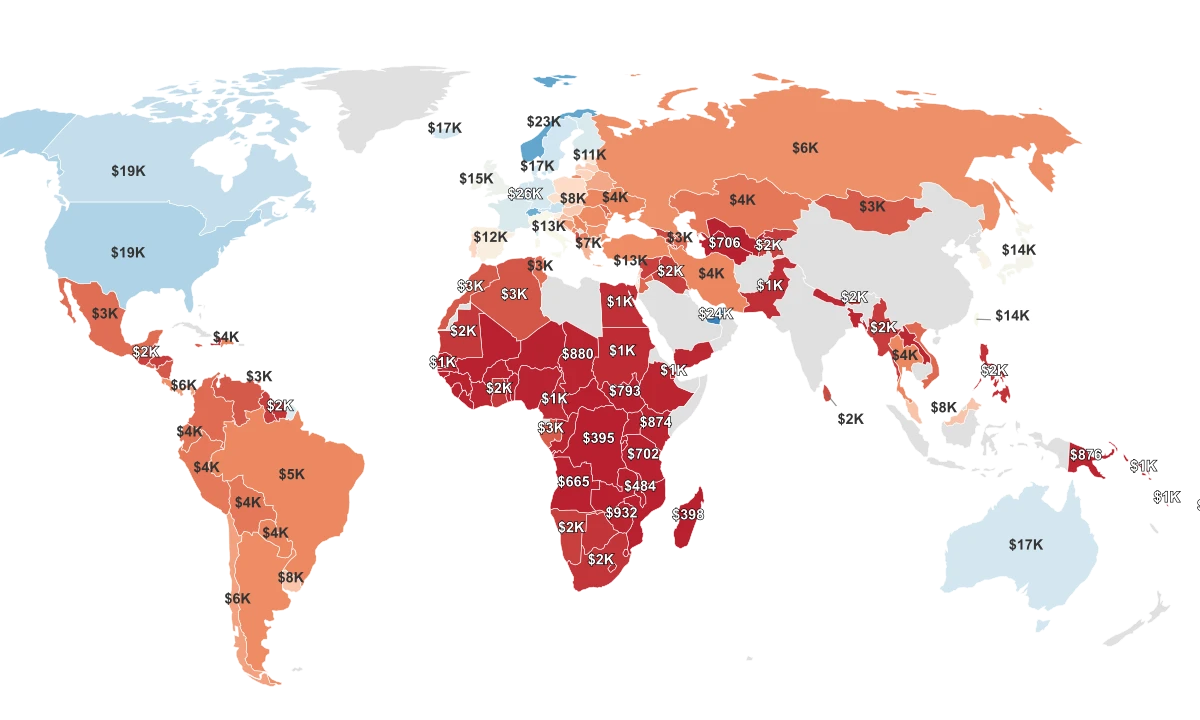
The poorest country in Asia by this measure is Afghanistan, at about $1,991 per person a year, and the richest is Macau, at roughly $144,916. The number behind both is GDP per capita adjusted for purchasing power: a country's total output divided across its people, then priced so the same dollar buys a comparable basket of goods everywhere. It comes from the International Monetary Fund's World Economic Outlook database, and the figures here are the IMF's estimates for 2025.
A higher number means more income per person, not a "better" country, and a lower number reflects how much output a place generates per resident, not the worth of the people who live there. That distinction is the whole point of this ranking. It does not measure how big a country is or how many people it holds. It measures what one person's slice of the economy is worth, which is why a populous country with a large total economy can still land near the floor.
Across the 49 economies here, the spread is enormous. The figures run from about $2,000 a year at the bottom to roughly $145,000 at the top, all expressed in the same purchasing-power dollars so they can be compared like for like. Where a country falls on that scale is the question the rest of this page works through.
Asia's Two Economies
Talk about the "average" Asian economy and you describe almost no real country. The average income per person across these 49 economies works out to about $35,840 a year. The typical country, the one sitting right in the middle of the ranking, earns closer to $21,113. The gap between those two numbers is not a rounding quirk. It is the signature of a continent split in two.
The reason is a short, very high tail. A handful of places earn so much per person that they drag the average upward, away from where most countries actually sit. Count the economies that fall below the average and you get 30 of the 49, the clear majority. Most of Asia lives below its own mean, while a few extreme earners pull that mean far above the middle of the pack.
The scale of the split is easier to feel at the edges. The richest place on the continent, Macau, earns roughly 73 times what the poorest, Afghanistan, earns per person. Both sit in the same region, drawn on the same map, measured the same way. They barely belong to the same economic world.
The Outliers at the Top
Three places stand apart from everything below them: Macau at about $144,916 per person, Singapore at roughly $144,145, and Qatar at around $124,394. Each clears six figures in purchasing-power dollars, and the rest of the continent does not come close. What unites them is not size. It is a concentrated source of wealth spread over a relatively small population.
Macau's economy is dominated by gaming and tourism. The IMF's 2024 Article IV review of Macao frames the territory's growth as driven by recovery in the gaming sector, the concentrated engine the authorities are trying to diversify away from. A large tourism-and-gaming revenue base divided across a small resident population produces a very high figure per person.
Singapore reaches a similar height by a different route. The World Bank describes the city-state as an important international trading hub, home to one of the world's busiest transshipment ports. A high-value trade-and-services economy packed into a small city lifts output per resident the way few arrangements can.
Qatar's wealth runs on hydrocarbons. Britannica's account of the economy ties it to the extraction and export of petroleum and natural gas, with the country recording one of the highest per-capita incomes anywhere, a pattern the World Bank's own per-capita data corroborates. Energy revenue over a small population, again, is what carries the number so high.
The Floor: Where Income Per Person Runs Out
At the bottom of the ranking, income per person thins to a fraction of the regional middle. Afghanistan anchors the floor at about $1,991 a year, with Yemen just above at roughly $2,237. Timor-Leste follows near $3,845, and Nepal and Myanmar sit close together a little higher, at about $5,535 and $5,566. Each figure traces to a documented structural condition, not a verdict on the country.
Afghanistan's position reflects a post-2021 economic collapse. The World Bank reports the economy contracting by 25% since August 2021, as the cut-off of international aid, frozen central-bank reserves, and lost access to the global banking system drove output down. Yemen's low figure is tied to war: the World Bank attributes the crisis to prolonged conflict and records a 54 percent drop in real GDP per capita since 2015, a decline measured in the same per-person terms this ranking uses.
The causes above the floor are different in kind but no less structural. Timor-Leste is one of Asia's youngest nations, and the IMF describes an economy that leans on a Petroleum Fund as oil and gas production is dwindling, a young petro-state whose private sector has yet to diversify. Nepal's constraint is geography: the World Bank notes that its landlocked and mountainous terrain raises trade costs, and its broader research on landlocked developing countries documents how that condition keeps many of them among the poorest in the world.
Myanmar's figure follows a sharp contraction. The World Bank projected the economy would contract by around 18 percent in the year after the February 2021 military takeover, leaving output far below where it would otherwise have been. Conflict, geography, young statehood, institutional collapse: the bottom of this ranking is not a list of failures so much as a record of conditions that hold income per person down.
How to Read These Numbers
One caveat is worth carrying through all of this. The 2025 figures are IMF estimates rather than final, measured outturns, and the purchasing-power adjustment behind them is a modeled calculation, not a census of what people are paid. That makes these numbers well-grounded comparisons of how far income stretches from one country to the next, not exact paychecks. Read them as a reliable map of the gaps between economies, which is precisely what they are built to show.
Sources & Notes
Gross domestic product divided by population, converted to international dollars using purchasing power parity rates.