Most Polluted Countries

1 | Chad | 91.8 | |
2 | Bangladesh | 78 | |
3 | Pakistan | 73.7 | |
4 | DR Congo | 58.2 | |
5 | India | 50.6 | |
6 | Tajikistan | 46.3 | |
7 | Nepal | 42.8 | |
8 | Uganda | 41 | |
9 | Rwanda | 40.8 | |
10 | Burundi | 40.3 | |
11 | Nigeria | 40.1 | |
12 | Egypt | 39.8 | |
13 | Iraq | 38.4 | |
14 | Ghana | 35.8 | |
15 | Indonesia | 35.5 | |
16 | Gambia | 35.2 | |
17 | United Arab Emirates | 33.7 | |
18 | Bahrain | 31.8 | |
19 | Uzbekistan | 31.4 | |
20 | Qatar | 31.3 | |
21 | China | 31 | |
22 | Kuwait | 30.2 | |
23 | Vietnam | 28.7 | |
24 | Cameroon | 27.6 | |
25 | Laos | 27.5 | |
26 | Turkmenistan | 26.5 | |
27 | Togo | 26 | |
28 | Mongolia | 25.6 | |
29 | Bosnia and Herzegovina | 25.3 | |
30 | Myanmar | 25.2 | |
31 | Saudi Arabia | 25.1 | |
32 | Zimbabwe | 24.8 | |
33 | Ivory Coast | 24.6 | |
34 | Armenia | 24.4 | |
35 | North Macedonia | 23.3 | |
36 | Senegal | 22.3 | |
36 | Libya | 22.3 | |
38 | Ethiopia | 22.2 | |
39 | Zambia | 22 | |
40 | Cambodia | 21.9 | |
41 | Kyrgyzstan | 21.1 | |
41 | Palestine | 21.1 | |
43 | Madagascar | 20.5 | |
44 | Serbia | 20.2 | |
45 | Thailand | 19.8 | |
46 | South Africa | 18.8 | |
46 | Guatemala | 18.8 | |
48 | Malaysia | 18.3 | |
48 | Azerbaijan | 18.3 | |
50 | Montenegro | 18 | |
51 | Sri Lanka | 17.9 | |
52 | Macau | 17.7 | |
53 | Guyana | 17.5 | |
53 | Taiwan | 17.5 | |
55 | Mexico | 17.4 | |
56 | El Salvador | 17.3 | |
57 | Israel | 17.2 | |
58 | Peru | 17.1 | |
59 | South Korea | 17 | |
60 | Djibouti | 16.8 | |
61 | Mozambique | 16.7 | |
62 | Chile | 16.6 | |
63 | Hong Kong | 16.3 | |
64 | Paraguay | 15.9 | |
65 | Algeria | 15.4 | |
66 | Romania | 15.3 | |
66 | Turkey | 15.3 | |
68 | Slovenia | 15.2 | |
68 | Honduras | 15.2 | |
68 | Gabon | 15.2 | |
71 | Kazakhstan | 15.1 | |
71 | Georgia | 15.1 | |
73 | Brazil | 14.9 | |
74 | Nicaragua | 14.8 | |
74 | Philippines | 14.8 | |
74 | Poland | 14.8 | |
77 | Moldova | 14.7 | |
78 | Albania | 14.5 | |
79 | Kenya | 14.3 | |
80 | Italy | 14.2 | |
81 | Croatia | 13.8 | |
81 | Colombia | 13.8 | |
83 | Slovakia | 13.6 | |
84 | Kosovo | 12.9 | |
84 | Hungary | 12.9 | |
86 | Cyprus | 12.8 | |
87 | Czech Republic | 12.7 | |
88 | Suriname | 12.5 | |
89 | Bulgaria | 12.4 | |
90 | Maldives | 12.2 | |
91 | Malta | 11.7 | |
92 | Greece | 11.5 | |
92 | Uruguay | 11.5 | |
94 | Singapore | 11.4 | |
95 | Austria | 10.2 | |
96 | Panama | 10.1 | |
96 | Lithuania | 10.1 | |
98 | Bolivia | 10 | |
99 | Russia | 9.8 | |
100 | Ecuador | 9.7 | |
101 | Latvia | 9.2 | |
101 | Ukraine | 9.2 | |
103 | Germany | 9 | |
104 | Belgium | 8.9 | |
104 | Netherlands | 8.9 | |
106 | Argentina | 8.7 | |
106 | Spain | 8.7 | |
108 | Japan | 8.6 | |
109 | Cayman Islands | 8.5 | |
110 | France | 8.1 | |
111 | Luxembourg | 7.5 | |
112 | Anguilla | 7.4 | |
112 | United Kingdom | 7.4 | |
114 | Switzerland | 7.3 | |
115 | Denmark | 7.2 | |
116 | United States | 7.1 | |
117 | Costa Rica | 7 | |
118 | Portugal | 6.8 | |
119 | Canada | 6.7 | |
120 | Norway | 6.6 | |
121 | Liechtenstein | 6.5 | |
121 | Ireland | 6.5 | |
123 | Trinidad and Tobago | 6.1 | |
124 | Andorra | 6 | |
125 | Sweden | 5.3 | |
126 | Finland | 5.2 | |
127 | Estonia | 4.6 | |
128 | Australia | 4.5 | |
129 | New Zealand | 4.4 | |
130 | Iceland | 4 | |
131 | Grenada | 3.2 | |
132 | Barbados | 3.1 | |
133 | Montserrat | 2.7 | |
133 | Puerto Rico | 2.7 | |
135 | Bermuda | 2.5 | |
135 | French Polynesia | 2.5 | |
137 | Bahamas | 2.3 |
Last updated June 25, 2026
Key Takeaways
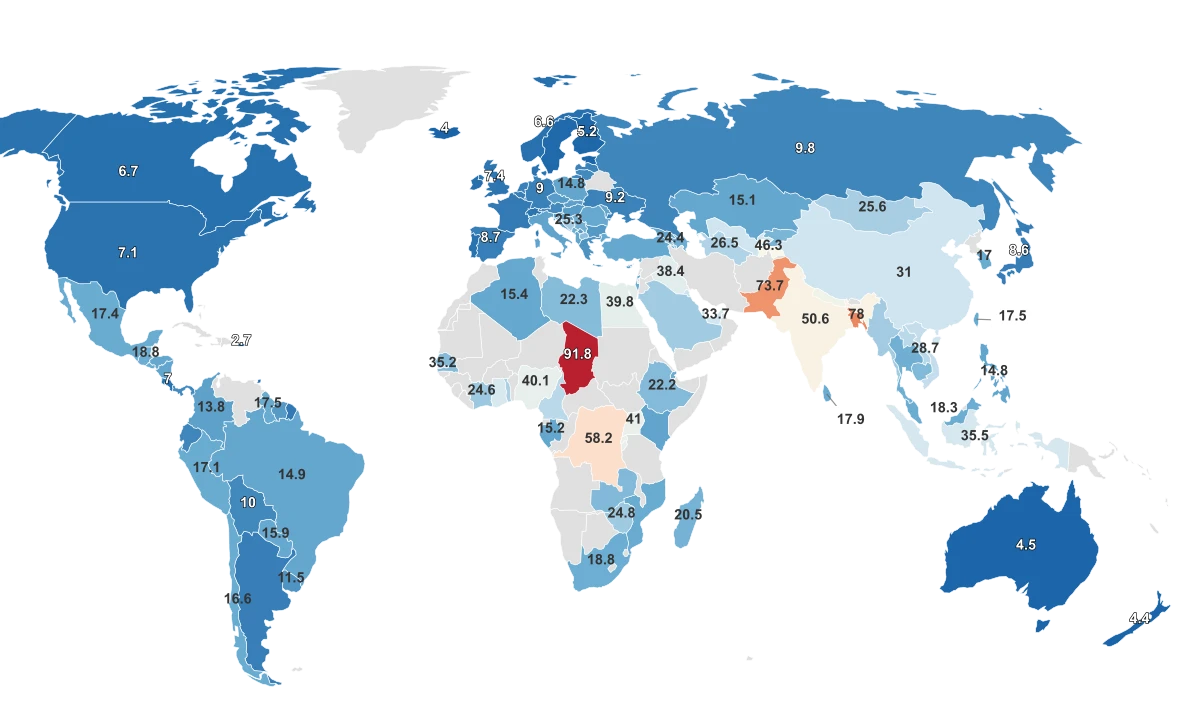
- Chad has the world's dirtiest air, averaging 91.8 µg/m³ of fine particulate matter in 2024.
- The Bahamas breathes the cleanest air in the ranking, at just 2.3 µg/m³.
- Chad's air carries roughly 40 times the particulate load of the cleanest country, and about 18 times the level the World Health Organization considers safe.
- The dirtiest air is not an industrial-megacity story: the country at the top runs largely on natural Saharan desert dust.
All Metrics
Where the World Breathes the Dirtiest Air
This ranking measures fine particulate matter, the microscopic specks known as PM2.5 that lodge deep in the lungs, reported as an average annual concentration in micrograms per cubic meter. Chad records the dirtiest air at 91.8 µg/m³, while the Bahamas sits at the clean end of the table at 2.3 µg/m³. A higher number means dirtier air, so leading this ranking is the unwelcome distinction, not the prize.
The figures come from IQAir's 2024 World Air Quality Report, which builds each country's population-weighted annual average from ground monitors and validated sensors. The natural reference point is the World Health Organization's annual guideline of 5 µg/m³, the level it considers safe over a year. Measured against that line, most countries in this dataset sit well above the guideline, and only a short list of nations slips under it.
Chad and the Outlier Five
The top of this table is not a gentle slope but a cliff. Chad averages 91.8 µg/m³, the widest gap above the global mean of any country in the data, and its air carries roughly 18 times the particulate load the WHO considers safe. The surprise is the source: much of it is natural. NASA identifies the Bodélé Depression, a dried lakebed in northern Chad, as one of the Sahara's largest dust sources, with strong winds funneling fine mineral dust across the region before household cooking fires and crop burning add to the load.
Behind Chad sits a tight cluster of countries that also break far above the pack. Bangladesh reads 78.0 µg/m³ and Pakistan 73.7 µg/m³, the next two on the list. The Democratic Republic of the Congo and India round out a top five that all sit several rungs above where most of the world lives. In the South Asian cases the drivers are man-made and shared. The World Bank traces the haze to crop residue burning, brick kilns, transport, and solid-fuel cooking, and notes that over half the pollution is transboundary, drifting across borders and pooling in the Indo-Gangetic basin where mountains trap it.
Why the Average Lies
Reach for a single number to summarize global air and it will mislead you. The typical country reads about 15.2 µg/m³, but a short tail of extreme polluters pulls the headline average well above that, so most of the world is actually cleaner than the mean implies. The story sits at the two ends, not in the middle.
That does not mean the rest of the world breathes easy. Even with the worst cases set aside, roughly nine in ten countries in the ranking exceed the WHO guideline of 5 µg/m³, and the median country sits at three times it. The WHO ties ambient air pollution to 4.2 million premature deaths a year, which is why the gap between the cleanest air and the rest matters far more than the average alone suggests.
Cleaner Governance, Cleaner Air
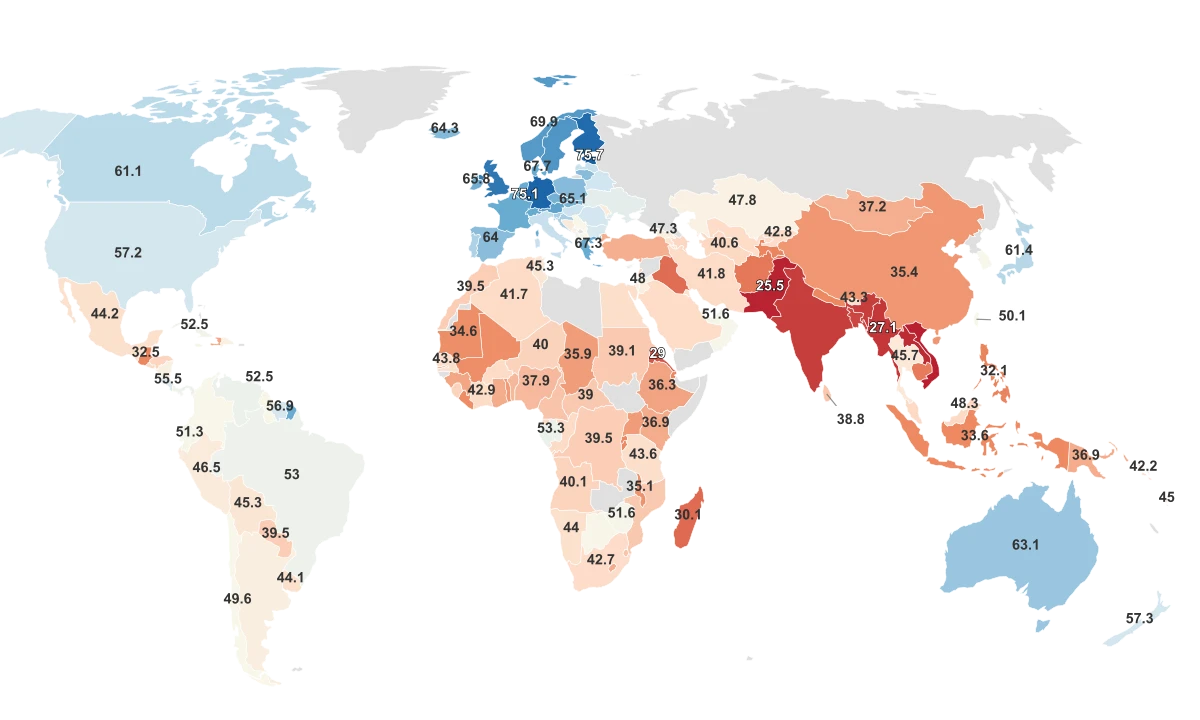
The countries with the cleanest air are not the poorest or the least industrial, which is the reverse of what many assume. They are wealthier, better-governed states that have invested in cleaner energy and tighter environmental rules. When each country's PM2.5 is set against its score on Yale's Environmental Performance Index, a broad measure of environmental health and policy, the two move firmly in opposite directions: stronger environmental performance lines up with cleaner air.
Cleaner Environmental Records Track With Cleaner Air
Across 122 countries, higher Environmental Performance Index scores line up with lower PM2.5, the reverse of the idea that pollution is the price of progress.
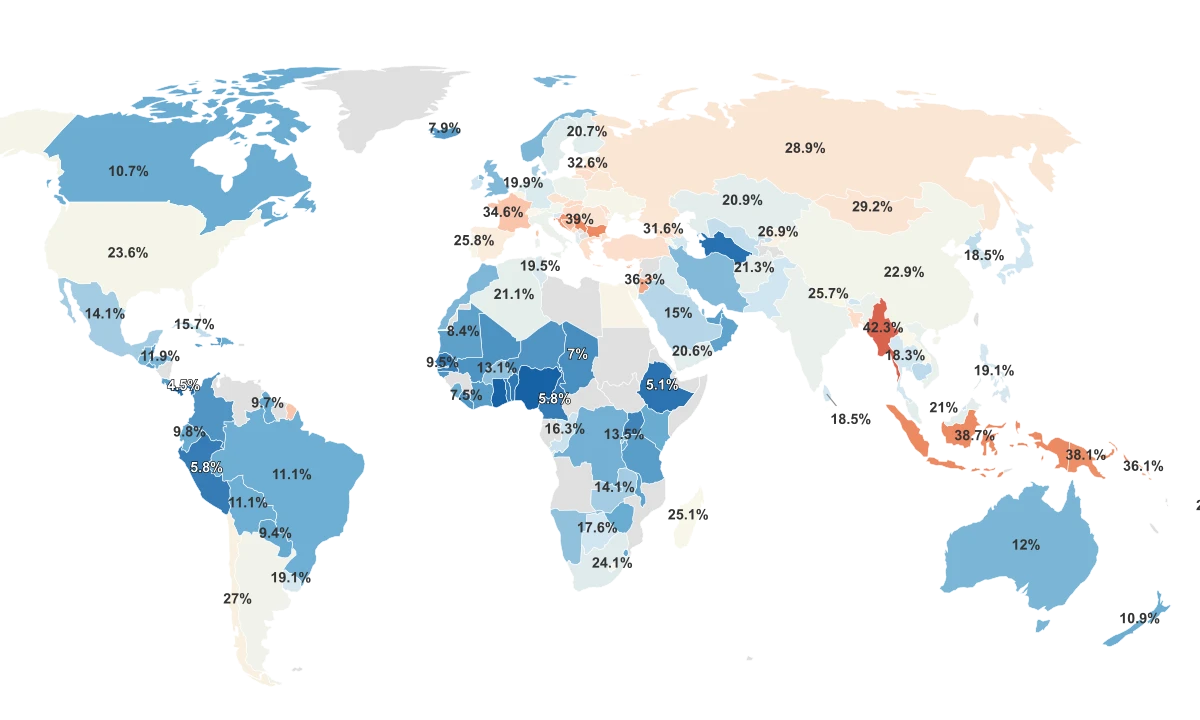
The pattern is not perfect, but it is strong, and a country's environmental-performance score accounts for roughly 43 percent of the variation in its air quality. The dirtiest-air nations sit near the bottom of the index, with Pakistan, India, and Bangladesh all scoring in its lowest reaches, while the cleanest-air countries cluster near the top. One example of the lever at work: Croatia lifted renewables past 31 percent of its energy mix and set a course to phase out coal, the kind of policy choice that bends a country's air quality over time.
Sources & Notes
Average concentration of PM2.5 particles in micrograms per cubic meter.
Composite index that assesses a country's environmental health and ecosystem vitality.