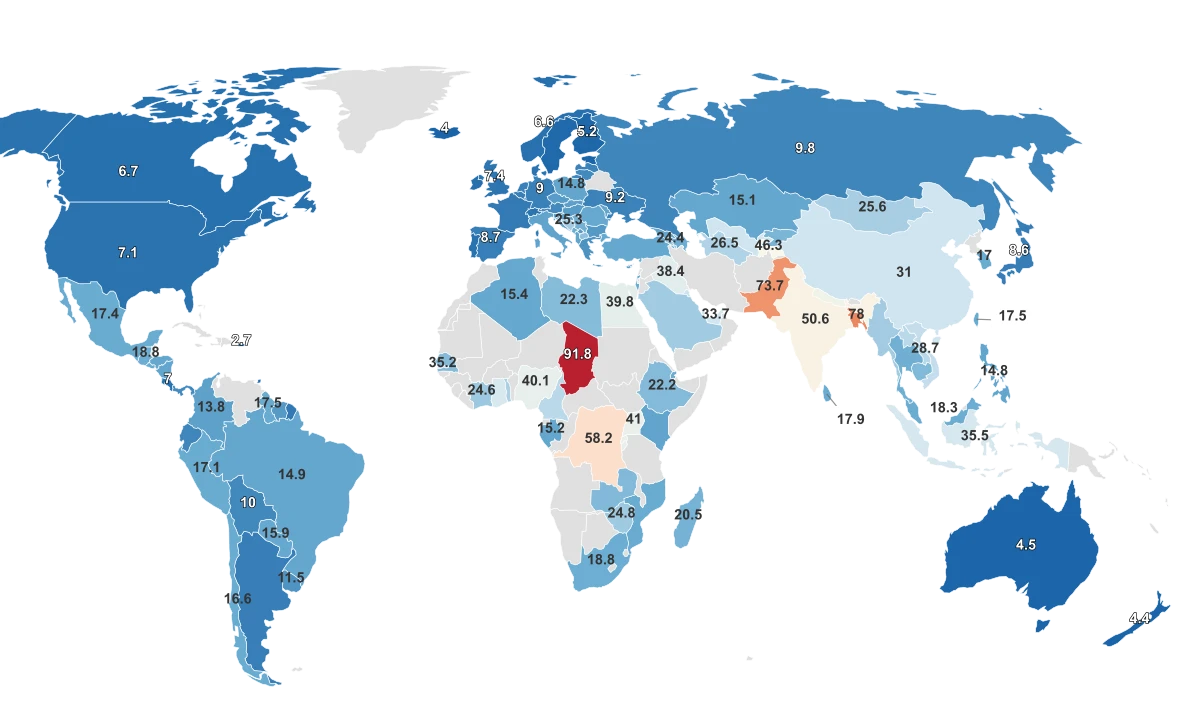
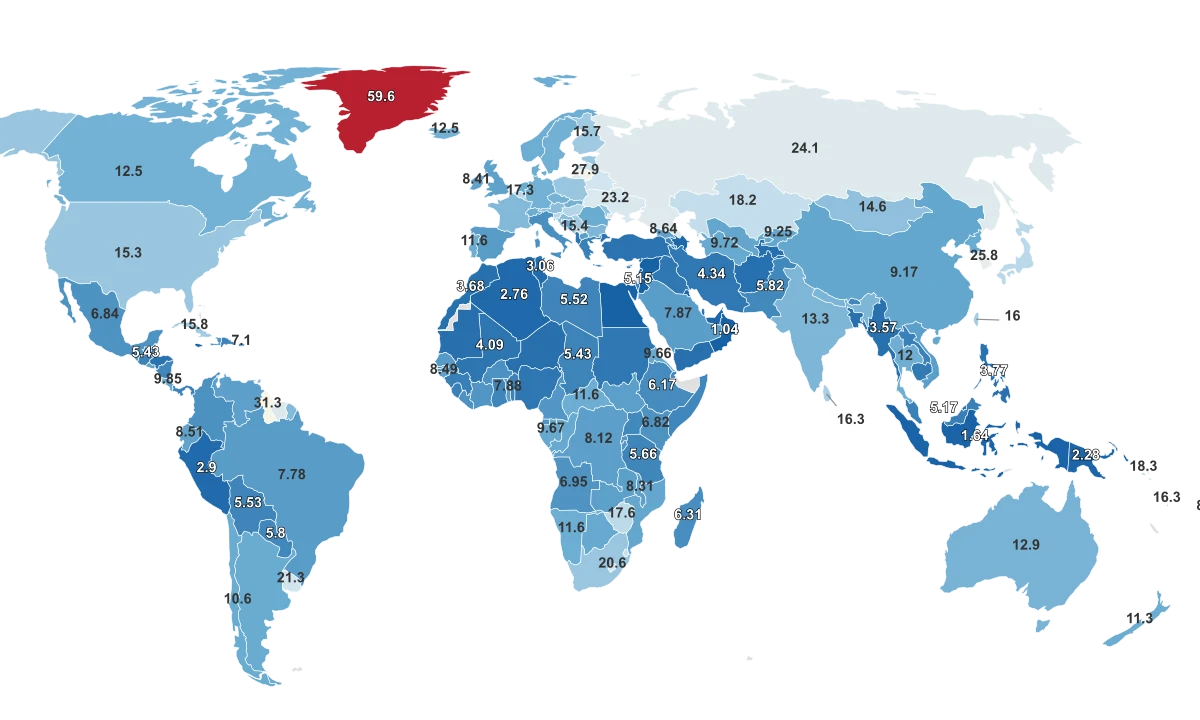
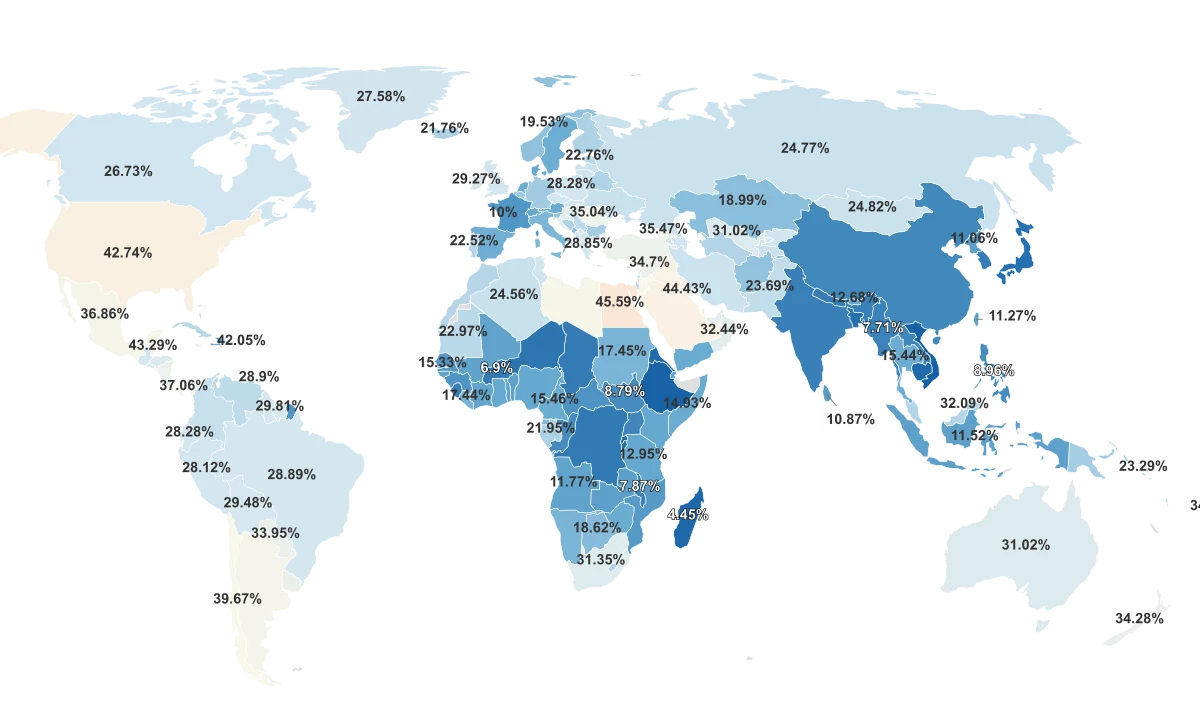
Most Obese Countries

1 |  | American Samoa | 75.92% |
2 |  | Tonga | 72.35% |
3 |  | Nauru | 71.06% |
4 |  | Cook Islands | 69.58% |
5 |  | Niue | 67.27% |
6 |  | Tuvalu | 65.25% |
7 |  | Samoa | 63.67% |
8 |  | French Polynesia | 49% |
9 |  | Micronesia | 48.19% |
10 |  | Bahamas | 48.15% |
11 |  | Marshall Islands | 47.11% |
12 |  | Kiribati | 46.89% |
13 |  | Saint Kitts and Nevis | 46.65% |
14 |  | Egypt | 45.59% |
15 |  | Kuwait | 44.43% |
16 |  | Qatar | 44% |
17 |  | Belize | 43.29% |
18 |  | United States | 42.74% |
19 |  | Saudi Arabia | 42.45% |
20 |  | Palau | 42.08% |
21 |  | Puerto Rico | 42.05% |
22 |  | Iraq | 41.41% |
23 |  | Jordan | 39.93% |
24 |  | Chile | 39.67% |
25 |  | Barbados | 38.9% |
26 |  | Palestine | 38.52% |
27 |  | Libya | 37.91% |
28 |  | Bahrain | 37.25% |
29 |  | Panama | 37.06% |
30 |  | Mexico | 36.86% |
31 |  | Argentina | 36.39% |
32 |  | Georgia | 35.47% |
33 |  | Romania | 35.04% |
34 |  | Fiji | 34.9% |
35 |  | Syria | 34.7% |
36 |  | Nicaragua | 34.54% |
36 |  | Jamaica | 34.54% |
38 |  | Turkey | 34.4% |
39 |  | New Zealand | 34.28% |
40 |  | Uruguay | 34.23% |
41 |  | Saint Lucia | 34.15% |
42 |  | Saint Vincent and the Grenadines | 34.11% |
43 |  | Antigua and Barbuda | 34.02% |
44 |  | Bermuda | 33.96% |
45 |  | Paraguay | 33.95% |
46 |  | Malta | 32.84% |
47 |  | United Arab Emirates | 32.63% |
48 |  | Hungary | 32.53% |
49 |  | Oman | 32.44% |
50 |  | Costa Rica | 32.29% |
51 |  | Dominica | 32.15% |
52 |  | Brunei | 32.09% |
53 |  | Croatia | 31.44% |
54 |  | South Africa | 31.35% |
55 |  | El Salvador | 31.31% |
56 |  | Grenada | 31.12% |
57 |  | Uzbekistan | 31.02% |
57 |  | Australia | 31.02% |
59 |  | Lebanon | 30.72% |
60 |  | Eswatini | 30.64% |
61 |  | Honduras | 30.31% |
62 |  | Dominican Republic | 30.25% |
63 |  | Seychelles | 30.19% |
64 |  | Suriname | 29.81% |
65 |  | Bolivia | 29.48% |
66 |  | Ireland | 29.27% |
67 |  | Guyana | 28.96% |
68 |  | Trinidad and Tobago | 28.9% |
69 |  | Brazil | 28.89% |
70 |  | Greece | 28.85% |
71 |  | North Macedonia | 28.41% |
72 |  | Ecuador | 28.28% |
72 |  | Poland | 28.28% |
74 |  | Peru | 28.12% |
75 |  | Tunisia | 27.71% |
76 |  | United Kingdom | 27.63% |
77 |  | Greenland | 27.58% |
78 |  | Slovakia | 27.57% |
78 |  | Guatemala | 27.57% |
80 |  | Azerbaijan | 27.33% |
81 |  | Czech Republic | 26.85% |
82 |  | Kyrgyzstan | 26.83% |
83 |  | Canada | 26.73% |
84 |  | Lithuania | 26.02% |
85 |  | Iran | 25.08% |
86 |  | Armenia | 25.06% |
87 |  | Latvia | 24.85% |
88 |  | Mongolia | 24.82% |
89 |  | Russia | 24.77% |
90 |  | Tajikistan | 24.64% |
91 |  | Algeria | 24.56% |
92 |  | Ukraine | 24.41% |
93 |  | Colombia | 24.33% |
94 |  | Albania | 24.31% |
95 |  | Pakistan | 23.69% |
96 |  | Moldova | 23.68% |
97 |  | Cyprus | 23.55% |
98 |  | Venezuela | 23.33% |
99 |  | Solomon Islands | 23.29% |
100 |  | Israel | 23.16% |
101 |  | Serbia | 23.1% |
102 |  | Mauritania | 22.97% |
103 |  | Estonia | 22.76% |
104 |  | Cuba | 22.55% |
105 |  | Morocco | 22.53% |
106 |  | Portugal | 22.52% |
107 |  | Malaysia | 22.41% |
108 |  | Turkmenistan | 22.15% |
109 |  | Vanuatu | 22.05% |
109 |  | Belarus | 22.05% |
111 |  | Bosnia and Herzegovina | 21.97% |
111 |  | Finland | 21.97% |
113 |  | Gabon | 21.95% |
114 |  | Iceland | 21.76% |
115 |  | Lesotho | 21.74% |
116 |  | Bulgaria | 21.24% |
117 |  | Papua New Guinea | 21.15% |
118 |  | Germany | 20.99% |
119 |  | Belgium | 20.51% |
120 |  | Slovenia | 19.93% |
121 |  | Afghanistan | 19.59% |
121 |  | Mauritius | 19.59% |
123 |  | Norway | 19.53% |
124 |  | Kazakhstan | 18.99% |
125 |  | Luxembourg | 18.89% |
126 |  | Montenegro | 18.68% |
127 |  | Botswana | 18.62% |
127 |  | Equatorial Guinea | 18.62% |
129 |  | Andorra | 18.61% |
130 |  | Maldives | 17.9% |
131 |  | Italy | 17.81% |
132 |  | Namibia | 17.47% |
133 |  | Sudan | 17.45% |
134 |  | Liberia | 17.44% |
135 |  | Sao Tome and Principe | 17.16% |
136 |  | Comoros | 16.81% |
137 |  | Cape Verde | 16.35% |
138 |  | Spain | 16.15% |
139 |  | Austria | 15.67% |
140 |  | Sweden | 15.6% |
141 |  | Cameroon | 15.46% |
142 |  | Thailand | 15.44% |
143 |  | Gambia | 15.33% |
144 |  | Netherlands | 14.98% |
145 |  | Somalia | 14.93% |
146 |  | Zimbabwe | 14.21% |
147 |  | Yemen | 14.06% |
148 |  | Singapore | 13.97% |
149 |  | Denmark | 13.55% |
150 |  | Ghana | 13.28% |
151 |  | Tanzania | 12.95% |
152 |  | Kenya | 12.87% |
153 |  | Nigeria | 12.84% |
154 |  | Bhutan | 12.68% |
155 |  | Switzerland | 12.47% |
156 |  | Ivory Coast | 12.09% |
157 |  | Togo | 11.96% |
158 |  | Mali | 11.82% |
159 |  | Angola | 11.77% |
160 |  | Guinea Bissau | 11.72% |
161 |  | Djibouti | 11.68% |
162 |  | Indonesia | 11.52% |
163 |  | Benin | 11.51% |
164 |  | Taiwan | 11.27% |
165 |  | Zambia | 11.24% |
166 |  | North Korea | 11.06% |
167 |  | Haiti | 11.05% |
168 |  | Sri Lanka | 10.87% |
169 |  | Mozambique | 10.46% |
170 |  | Senegal | 10.25% |
171 |  | France | 10% |
172 |  | Guinea | 9.74% |
173 |  | Central African Republic | 9.57% |
174 |  | Philippines | 8.96% |
175 |  | Republic of the Congo | 8.84% |
176 |  | South Sudan | 8.79% |
177 |  | China | 8.37% |
178 |  | Laos | 8.32% |
179 |  | Uganda | 8.05% |
180 |  | Malawi | 7.87% |
181 |  | Myanmar | 7.71% |
182 |  | India | 7.51% |
183 |  | Sierra Leone | 7.32% |
184 |  | South Korea | 7.24% |
185 |  | Nepal | 7.18% |
186 |  | Chad | 7.01% |
187 |  | Burkina Faso | 6.9% |
188 |  | DR Congo | 6.89% |
189 |  | Niger | 6.21% |
190 |  | Japan | 5.57% |
191 |  | Bangladesh | 5.41% |
192 |  | Burundi | 5.27% |
193 |  | Rwanda | 4.99% |
194 |  | Eritrea | 4.94% |
195 |  | Cambodia | 4.5% |
196 |  | Madagascar | 4.45% |
197 |  | Ethiopia | 2.9% |
198 |  | Timor Leste | 2.41% |
199 |  | Vietnam | 2.04% |
Last updated June 25, 2026
Key Takeaways
- American Samoa records the highest adult obesity rate in the world at about 76 percent, based on 2022 estimates.
- Vietnam sits at the other end at roughly 2 percent, the lowest of the 199 countries and territories measured.
- The seven highest rates all belong to Pacific Island nations, and each sits far above every other country on the list.
- Among large industrialized nations, the United States ranks highest at close to 43 percent, still below the Pacific leaders.
All Metrics
How the World's Adult Obesity Rates Are Actually Distributed in 2022
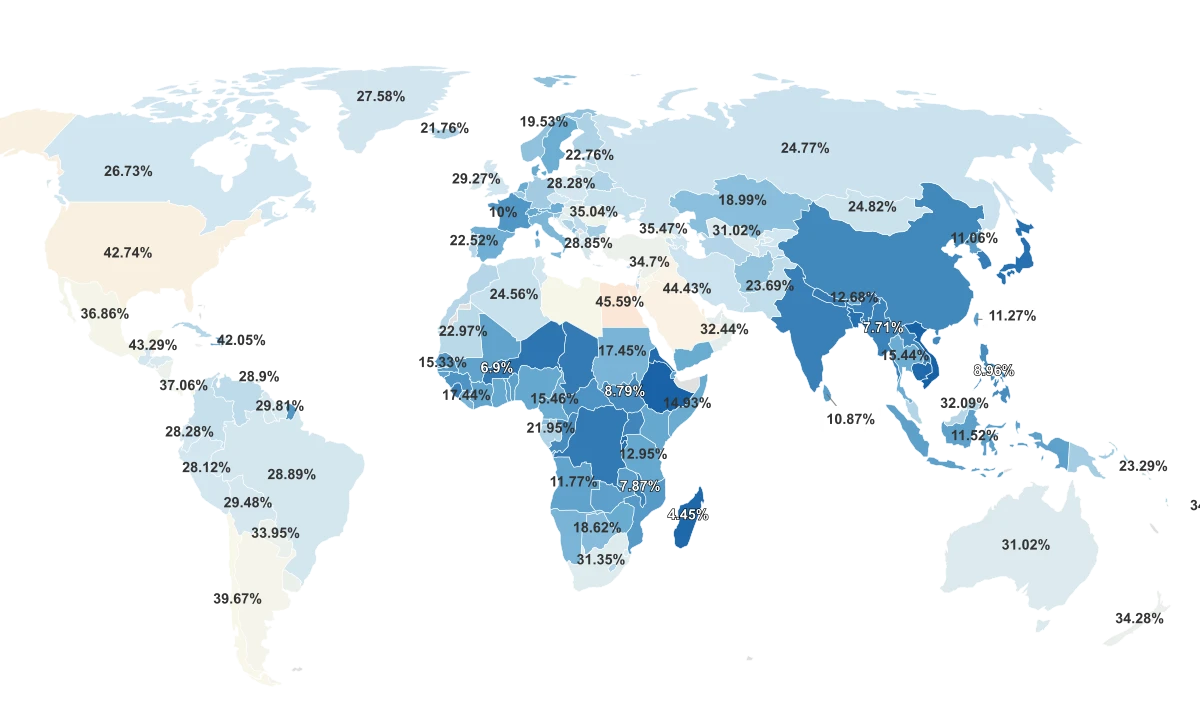
This ranking measures the share of adults living with obesity, defined by the World Health Organization as a body-mass index of 30 or higher, which is a stricter threshold than the BMI of 25 used to define overweight. In the 2022 estimates compiled by the NCD Risk Factor Collaboration, American Samoa has the highest rate at about 76 percent of adults, while Vietnam has the lowest at close to 2 percent. A higher figure means a larger share of the adult population is living with obesity, not that a country is mismanaged or that its people have failed.
The numbers come from measured height and weight pooled across population surveys rather than self-reported data, which makes them a comparatively reliable read on a sensitive health measure. Most countries fall well below the global midpoint, where a typical nation sits near 23 percent, and the figures climb steeply only at the very top of the table. The countries with the lowest rates cluster in East and Southeast Asia and parts of East Africa, with Ethiopia, Timor Leste and Vietnam all under 3 percent.
Why a Handful of Pacific Islands Sit So Far Above Everyone Else
The single most striking feature of this data is how far the top of the list separates from the rest of the world. The seven highest rates all belong to Pacific Island nations, from American Samoa at about 76 percent down to Samoa at roughly 64 percent, and each one sits standalone above the next tier of countries. No nation outside the Pacific comes close to this band.
This concentration has a documented structural explanation rather than a behavioral one. Researchers describe a post-war nutrition transition in which small island and atoll economies moved away from fishing and subsistence agriculture toward imported, energy-dense processed foods. Limited arable land and heavy reliance on trade left these communities dependent on what could be shipped in cheaply, and one analysis notes that the value of Tonga's food imports from New Zealand exceeds its food exports by twentyfold.
That dependence is tied to economic and colonial history more than to choice. Work in the journal Public Health Nutrition traces the displacement of traditional Pacific diets by imported food to long-running social and economic change across the region. Read this way, the cluster at the top of the table reflects the food environment a population inherited, not a verdict on the people in it.
A Steep Cliff, Not a Smooth Slope
The global picture is not a gentle gradient from high to low. After the seventh-ranked nation, the rate drops by nearly 15 percentage points to the eighth country, French Polynesia at 49 percent, and the descent continues unevenly from there. The full span runs from about 76 percent at the top to roughly 2 percent at the bottom, so the highest national rate is close to thirty-seven times the lowest.
Because of that long upper reach, the worldwide average overstates how common obesity is in a typical country. Among the world's most populous nations the contrast is sharp: China, India and Vietnam all sit near the bottom, each under 9 percent. The United States, by comparison, ranks 18th at close to 43 percent, the highest rate of any large industrialized country.
| Rank | Country | Adult Obesity Rate |
|---|---|---|
| 1 | American Samoa | 75.9% |
| 2 | Tonga | 72.3% |
| 3 | Nauru | 71.1% |
| 4 | Cook Islands | 69.6% |
| 5 | Niue | 67.3% |
| 6 | Tuvalu | 65.2% |
| 7 | Samoa | 63.7% |
| 8 | French Polynesia | 49.0% |
| 9 | Micronesia | 48.2% |
| 10 | Bahamas | 48.1% |
| 18 | United States | 42.7% |
| 197 | Ethiopia | 2.9% |
| 199 | Vietnam | 2.0% |
Why the Numbers Are Higher for Women in Most Countries
Beneath the national totals sits a consistent pattern: adult obesity is more common among women than men in 155 of the 199 countries and territories measured. Across the dataset the average rate for women runs close to 29 percent, roughly eight points above the average for men near 21 percent, and in some countries the difference is far wider. In Egypt, for example, the rate among women is about 59 percent against 32 percent among men.
This gap is not simply biological. A peer-reviewed analysis in the European Journal of Clinical Nutrition found that obesity prevalence shows a clear gendered patterning, with greater prevalence and greater variation among women than men, and that measures of gender inequality were significantly associated with the size of that gap. The drivers it points to are social and economic, differing from one country to the next, which is why the gender difference is widest in some regions and nearly absent in others.
The takeaway across the whole ranking is the same. Whether the lens is a detached Pacific cluster, a steep global cliff or a gendered gap, the variation tracks the conditions people live within far more than anything about the people themselves.
Sources & Notes
% of adults classified as obese.
% of males classified as obese.
% of females classified as obese.