Cleanest Countries In The World

1▲13 |  | Estonia | 75.7+14.3 (+23%) |
2▲4 |  | Luxembourg | 75.1+2.8 (+3.9%) |
3▲10 |  | Germany | 74.5+12.1 (+19%) |
4▼1 |  | Finland | 73.8-2.7 (-3.5%) |
5▼3 |  | United Kingdom | 72.6-5.1 (-6.6%) |
6▼1 |  | Sweden | 70.3-2.4 (-3.3%) |
7▲13 |  | Norway | 69.9+10.6 (+18%) |
8— |  | Austria | 68.9+2.4 (+3.6%) |
9— |  | Switzerland | 67.8+1.9 (+2.9%) |
10▼9 |  | Denmark | 67.7-10.2 (-13%) |
11▲17 |  | Greece | 67.3+11.1 (+20%) |
12— |  | France | 67+4.5 (+7.2%) |
13▼9 |  | Malta | 66.9-8.3 (-11%) |
13▼2 |  | Netherlands | 66.9+4.3 (+6.9%) |
15▲6 |  | Belgium | 66.8+8.6 (+15%) |
16▲8 |  | Ireland | 65.8+8.4 (+15%) |
17▲2 |  | Czech Republic | 65.5+5.6 (+9.3%) |
18— |  | Slovakia | 65.1+5.1 (+8.5%) |
19▼9 |  | Iceland | 64.3+1.5 (+2.4%) |
20▲26 |  | Poland | 64.2+13.6 (+27%) |
21▲10 |  | Lithuania | 64.1+8.2 (+15%) |
22▲59 |  | Spain | 64+20.4 (+47%) |
23▼6 |  | Australia | 63.1+3 (+5.0%) |
24▼17 |  | Slovenia | 62.4-4.9 (-7.3%) |
25▼9 |  | Croatia | 62.3+2.1 (+3.5%) |
26▲22 |  | Portugal | 61.9+11.5 (+23%) |
27▼2 |  | Japan | 61.4+4.2 (+7.3%) |
28▲21 |  | Canada | 61.1+11.1 (+22%) |
29▼6 |  | Italy | 60.3+2.6 (+4.5%) |
30▼15 |  | Latvia | 60.2-0.9 (-1.5%) |
31▲2 |  | Hungary | 59.8+4.7 (+8.5%) |
32▲23 |  | Belarus | 58.2+9.7 (+20%) |
33▼3 |  | Romania | 57.3+1.3 (+2.3%) |
33▼7 |  | New Zealand | 57.3+0.6 (+1.1%) |
35▲8 |  | United States | 57.2+6.1 (+12%) |
36▲34 |  | Suriname | 56.9+11 (+24%) |
37▲4 |  | Bulgaria | 56.2+4.3 (+8.3%) |
38▼10 |  | Bahamas | 55.9-0.3 (-0.5%) |
39— |  | Antigua and Barbuda | 55.6+3.2 (+6.1%) |
40▲28 |  | Costa Rica | 55.5+9.2 (+20%) |
41▲11 |  | Ukraine | 54.6+5 (+10%) |
42▼6 |  | Saint Vincent and the Grenadines | 54.2+1 (+1.9%) |
43▼21 |  | Cyprus | 53.9-4.1 (-7.1%) |
44▲23 |  | Venezuela | 53.3+6.9 (+15%) |
44▲7 |  | Gabon | 53.3+3.6 (+7.2%) |
46▼10 |  | Barbados | 53.1-0.1 (-0.2%) |
47▼3 |  | Singapore | 53+2.1 (+4.1%) |
47▲34 |  | Brazil | 53+9.4 (+22%) |
49▼2 |  | Panama | 52.9+2.4 (+4.8%) |
50▲9 |  | Trinidad and Tobago | 52.5+4.7 (+9.8%) |
50▲10 |  | Cuba | 52.5+5 (+11%) |
52▲10 |  | Albania | 52.2+5.1 (+11%) |
53▲16 |  | Zimbabwe | 51.6+5.4 (+12%) |
53▼14 |  | United Arab Emirates | 51.6-0.8 (-1.5%) |
55▲11 |  | Ecuador | 51.3+4.8 (+10%) |
55▲94 |  | Oman | 51.3+20.6 (+67%) |
57▼4 |  | Saint Lucia | 51.1+1.7 (+3.4%) |
58▲5 |  | South Korea | 50.6+3.7 (+7.9%) |
59▼25 |  | North Macedonia | 50.3-4 (-7.4%) |
60▲14 |  | Taiwan | 50.1+4.8 (+11%) |
61▲68 |  | Timor Leste | 49.9+14.8 (+42%) |
62▲17 |  | Serbia | 49.8+5.9 (+13%) |
63▲24 |  | Colombia | 49.7+7.3 (+17%) |
64▲1 |  | Chile | 49.6+2.9 (+6.2%) |
65▼23 |  | Dominica | 49.3-1.9 (-3.7%) |
66▼31 |  | Botswana | 49.2-4.8 (-8.9%) |
67▲38 |  | Guyana | 49+10.5 (+27%) |
68▲4 |  | Jamaica | 48.5+2.9 (+6.4%) |
69▲2 |  | Brunei | 48.3+2.6 (+5.7%) |
70▼13 |  | Israel | 48-0.2 (-0.4%) |
71▼39 |  | Seychelles | 47.9-7.7 (-14%) |
72▲21 |  | Kazakhstan | 47.8+6.9 (+17%) |
73▼10 |  | Montenegro | 47.7+0.8 (+1.7%) |
73▲16 |  | Dominican Republic | 47.7+5.5 (+13%) |
75▲35 |  | Nicaragua | 47.4+9.7 (+26%) |
75▼26 |  | Belize | 47.4-2.6 (-5.2%) |
77— |  | Mauritius | 47.3+2.5 (+5.6%) |
77▲26 |  | Georgia | 47.3+8.2 (+21%) |
77▲4 |  | Jordan | 47.3+3.7 (+8.5%) |
80▲42 |  | Samoa | 47.1+10.7 (+29%) |
81▲11 |  | Argentina | 47+5.9 (+14%) |
82▲55 |  | Qatar | 46.8+13.8 (+42%) |
83▲18 |  | Peru | 46.5+6.7 (+17%) |
84— |  | Moldova | 46.1+3.4 (+8.0%) |
85▲62 |  | Fiji | 46+14.7 (+47%) |
85▲17 |  | Bosnia and Herzegovina | 46+6.6 (+17%) |
87▼29 |  | Grenada | 45.8-2.1 (-4.4%) |
88▲20 |  | Thailand | 45.7+7.6 (+20%) |
89▲7 |  | Tunisia | 45.3+4.6 (+11%) |
89▲10 |  | Bolivia | 45.3+5.2 (+13%) |
91▲28 |  | Vanuatu | 45+8.1 (+22%) |
92▼36 |  | Armenia | 44.9-3.4 (-7.0%) |
93▼6 |  | Kuwait | 44.4+2 (+4.7%) |
94▼40 |  | Kiribati | 44.3-4.7 (-9.6%) |
95▼22 |  | Mexico | 44.2-1.3 (-2.9%) |
96▲17 |  | Uruguay | 44.1+6.7 (+18%) |
97▼53 |  | Namibia | 44-6.9 (-14%) |
98▲38 |  | Senegal | 43.8+9.9 (+29%) |
99▲28 |  | Egypt | 43.7+8.2 (+23%) |
100▲34 |  | Tanzania | 43.6+9.4 (+27%) |
101▼16 |  | Bhutan | 43.3+0.8 (+1.9%) |
102▲36 |  | Ivory Coast | 42.9+10.1 (+31%) |
103▲23 |  | Kyrgyzstan | 42.8+7.1 (+20%) |
104▲12 |  | South Africa | 42.7+5.5 (+15%) |
105▲2 |  | Uzbekistan | 42.6+4.4 (+12%) |
106▲18 |  | Marshall Islands | 42.5+6.3 (+17%) |
106▲3 |  | Saudi Arabia | 42.5+4.6 (+12%) |
108▲22 |  | Solomon Islands | 42.2+7.2 (+21%) |
108▲19 |  | Burkina Faso | 42.2+6.7 (+19%) |
110▲23 |  | Iran | 41.8+7.3 (+21%) |
111▲44 |  | Algeria | 41.7+12.1 (+41%) |
111▼34 |  | Equatorial Guinea | 41.7-3.1 (-6.9%) |
113▼18 |  | El Salvador | 41.6+0.8 (+2.0%) |
113▼14 |  | Republic of the Congo | 41.6+1.5 (+3.7%) |
115▲15 |  | Malaysia | 41+6 (+17%) |
116▼3 |  | Micronesia | 40.8+3.4 (+9.1%) |
117▲1 |  | Turkmenistan | 40.6+3.6 (+9.7%) |
118▼14 |  | Azerbaijan | 40.5+1.9 (+4.9%) |
119▼39 |  | Tonga | 40.4-3.4 (-7.8%) |
120▲1 |  | Honduras | 40.2+3.7 (+10%) |
121▲30 |  | Angola | 40.1+9.6 (+31%) |
122▼12 |  | Niger | 40+2.3 (+6.1%) |
123▲19 |  | Lebanon | 39.9+7.7 (+24%) |
123▲17 |  | Sierra Leone | 39.9+7.2 (+22%) |
125▲35 |  | Morocco | 39.5+11.1 (+39%) |
125▼32 |  | Paraguay | 39.5-1.4 (-3.4%) |
125▼6 |  | DR Congo | 39.5+2.6 (+7.0%) |
128▲43 |  | Sudan | 39.1+11.5 (+42%) |
129▼54 |  | Central African Republic | 39-5.9 (-13%) |
129▲15 |  | Mozambique | 39+7.3 (+23%) |
131▲1 |  | Sri Lanka | 38.8+4.1 (+12%) |
132▼57 |  | Eswatini | 38.7-6.2 (-14%) |
133▲20 |  | Cameroon | 38.6+8.4 (+28%) |
134▼49 |  | Comoros | 38.2-4.3 (-10%) |
135▼22 |  | Maldives | 38.1+0.7 (+1.9%) |
136▼45 |  | Cape Verde | 38-3.9 (-9.3%) |
137▲25 |  | Nigeria | 37.9+9.6 (+34%) |
138▲17 |  | Benin | 37.8+8.2 (+28%) |
139▼17 |  | Gambia | 37.6+1.2 (+3.3%) |
140▲32 |  | Turkey | 37.2+10.9 (+41%) |
140▲15 |  | Mongolia | 37.2+7.6 (+26%) |
142▼1 |  | Lesotho | 36.9+4.6 (+14%) |
142▲6 |  | Kenya | 36.9+6.1 (+20%) |
142▲33 |  | Papua New Guinea | 36.9+12.1 (+49%) |
142▲28 |  | Ghana | 36.9+9.2 (+33%) |
146— |  | Guinea | 36.5+4.9 (+16%) |
147▲26 |  | Haiti | 36.4+10.3 (+39%) |
148▼5 |  | Ethiopia | 36.3+4.5 (+14%) |
149▼111 |  | Sao Tome and Principe | 36.2-16.7 (-32%) |
150▲15 |  | Chad | 35.9+7.8 (+28%) |
151▼26 |  | Uganda | 35.8 |
152▼17 |  | Togo | 35.7+1.7 (+5.0%) |
153▲7 |  | China | 35.4+7 (+25%) |
154▼64 |  | Bahrain | 35.3-6.7 (-16%) |
155▼58 |  | Malawi | 35.1-5.5 (-14%) |
156▲9 |  | Mauritania | 34.6+6.5 (+23%) |
157▲2 |  | Mali | 34.5+6 (+21%) |
158▲16 |  | Liberia | 34.3+9.4 (+38%) |
159▼21 |  | Rwanda | 33.9+1.1 (+3.4%) |
160▲4 |  | Indonesia | 33.6+5.4 (+19%) |
161▼10 |  | Burundi | 33.5+3 (+9.8%) |
162— |  | Nepal | 33.1+4.8 (+17%) |
163▲4 |  | Guatemala | 32.5+4.5 (+16%) |
164▼47 |  | Tajikistan | 32.3-4.8 (-13%) |
164▼104 |  | Djibouti | 32.3-15.2 (-32%) |
166▼8 |  | Philippines | 32.1+3.2 (+11%) |
167▼13 |  | Cambodia | 31.2+1.1 (+3.7%) |
168— |  | Afghanistan | 31 |
169— |  | Iraq | 30.3+2.5 (+9.0%) |
170▼3 |  | Madagascar | 30.1+2.1 (+7.5%) |
171▼27 |  | Eritrea | 29-2.7 (-8.5%) |
172▲5 |  | Bangladesh | 28.1+5 (+22%) |
173▲7 |  | India | 27.6+8.7 (+46%) |
174▲5 |  | Myanmar | 27.1+7.7 (+40%) |
175▼26 |  | Laos | 26.3-4.4 (-14%) |
176— |  | Pakistan | 25.5+0.9 (+3.7%) |
177▲1 |  | Vietnam | 24.6+4.5 (+22%) |
Last updated June 25, 2026
Key Takeaways
- Estonia is the cleanest country on the 2024 Environmental Performance Index, scoring 75.7 out of 100.
- Vietnam sits at the bottom of the 177 countries scored, at 24.6, just below Pakistan and Laos.
- The typical country lands near 45.3, so Estonia clears the middle of the table by roughly thirty points.
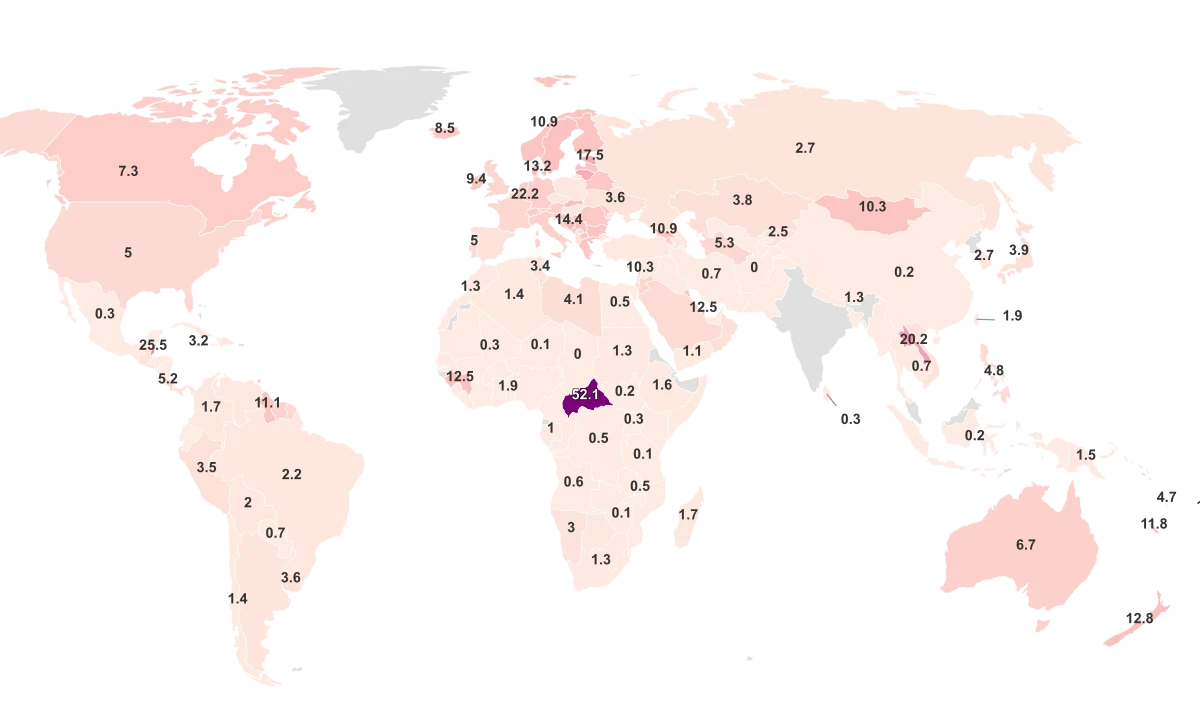
- Cleaner air tracks closely with a higher overall score, and the dirtiest-air country breathes about forty times the fine-particle load of the cleanest.
All Metrics
What "Cleanest" Actually Measures, and the Six Countries That Ace It
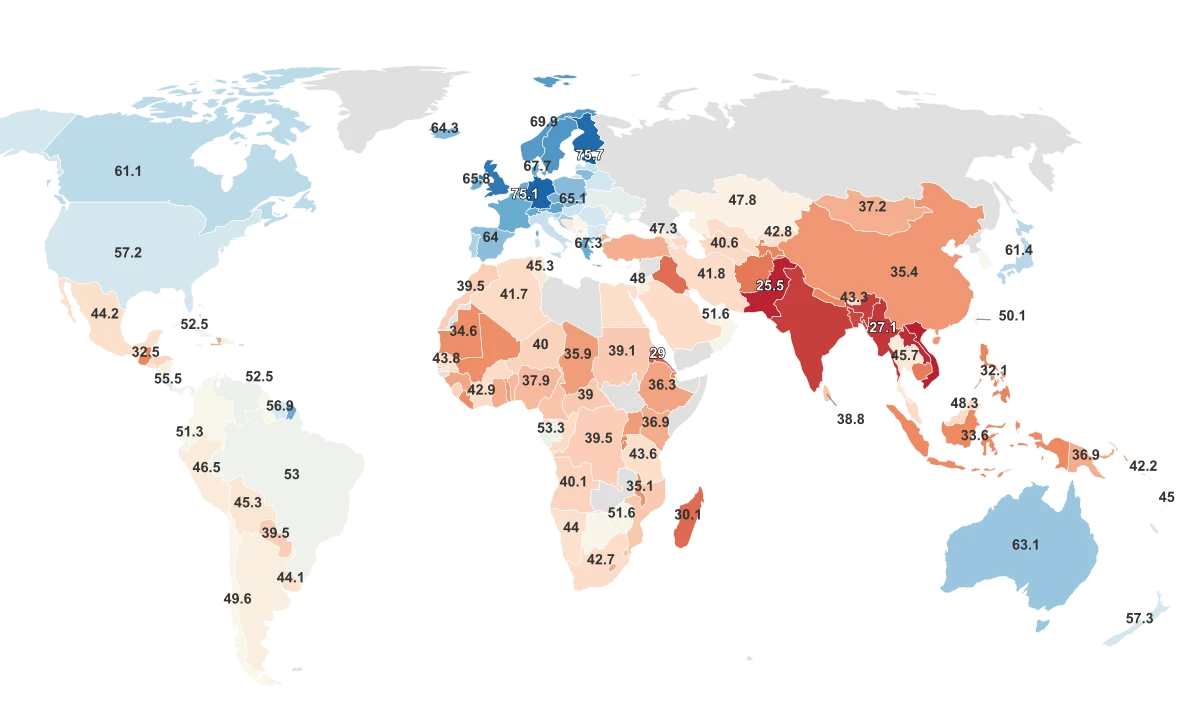
"Cleanest" here is not a judgment about tidy streets. The ranking is the 2024 Environmental Performance Index, a 0-to-100 score built by the Yale Center for Environmental Law and Policy from 58 separate indicators spanning climate change, environmental health and ecosystem vitality. A higher score means a country is closer to established environmental targets, so the top of this table is genuinely the cleaner end, not the other way around.
By that measure Estonia is the cleanest country in the world, at 75.7, while Vietnam finishes last of the countries scored, at 24.6, the lowest of the developing Asian nations Yale flags. Most countries land far below the leaders: the middle of the table sits near 45.3, which puts the typical nation closer to Vietnam's end of the spectrum than to Estonia's. The leaders are not a gentle slope down from the top so much as a short, high shelf with a long field stretched out beneath it.
The Top Is a Small Pack, Not a Smooth Climb
The cleanest countries form a tight northern-European cluster. Estonia (75.7), Luxembourg (75.1) and Germany (74.5) lead, with Finland, the United Kingdom and Sweden close behind, and all six sit far enough above the rest of the world that no other country comes near them. That is roughly thirty points clear of the typical nation, a separation the rest of the table never reproduces.
What buys that separation is mostly money and machinery of state. Yale credits Estonia's rise to a 40% drop in greenhouse-gas emissions over the last decade, achieved largely by replacing dirty oil shale power plants with cleaner energy, and frames the leaders as wealthy countries able to invest in the infrastructure that controls pollution. The pattern shows up in the gaps further down: the United States scores 57.2, enough for 35th place but a full eighteen points behind Estonia, a reminder that a rich country is not automatically a clean one.
Why the Air You Breathe Moves the Score
Air quality is one of the clearest threads running through the whole ranking. Across the 122 countries that appear in both datasets, a country's annual fine-particle pollution and its environmental score move strongly in opposite directions: the dirtier the air, the lower the score. Cleaner air alone accounts for roughly 43% of the variation in the overall index, which is a large share for any single factor in a measure built from 58 of them.
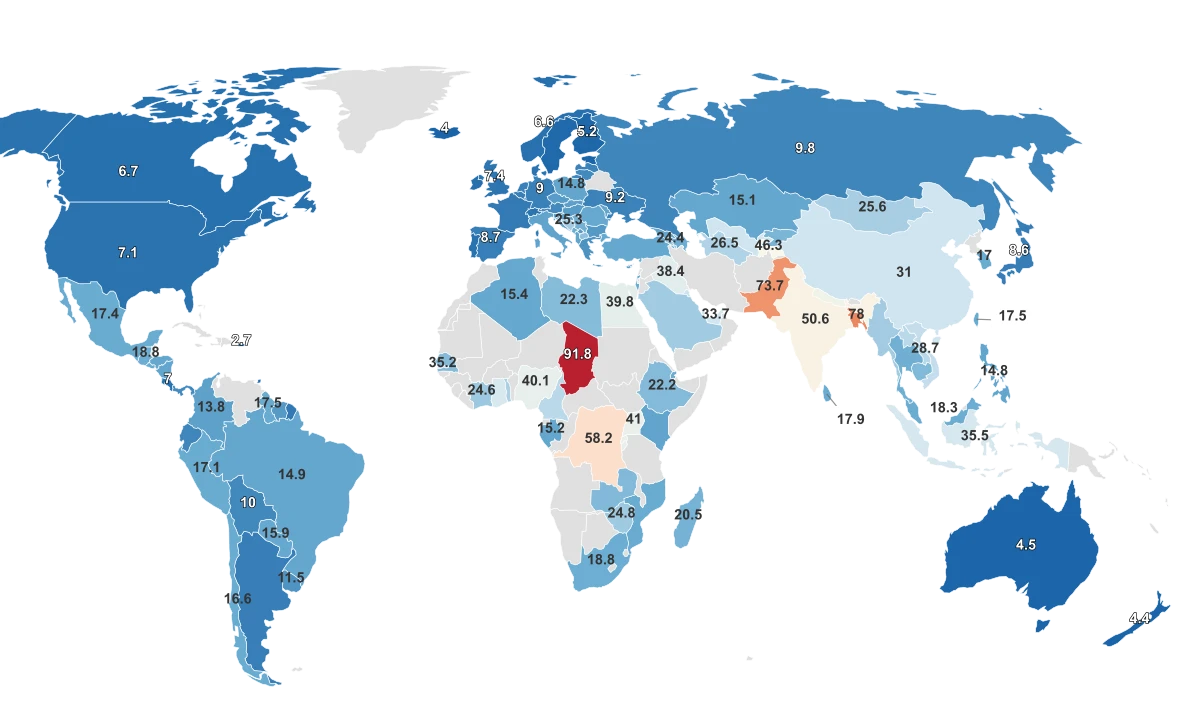
The extremes make the relationship visible. Chad averages 91.8 micrograms of fine particles per cubic meter, more than 18 times the World Health Organization guideline of 5, while the cleanest-air places such as the Bahamas sit near 2.3, a difference of roughly forty-fold. The countries at the top of the environmental index tend to breathe easy too: Estonia is one of only seven countries that met the WHO air guideline in 2024, so its clean air and its clean overall score are telling the same story.
Dirtier Air, Lower Environmental Score
Across 122 countries, rising fine-particle pollution tracks with a falling Environmental Performance Index, and the relationship holds at both extremes.
What the Index Can and Cannot Tell You
A single number flattens a lot, and the EPI is honest about its own limits. The index is recalculated every two years with new methods and new data, and Yale warns that a country's score should not be compared to scores from previous versions, so the figures here are best read as a 2024 snapshot rather than a trend line. A country that looks like it surged or slipped between editions may simply be measured differently.
The score also rewards commitments that do not always hold up on the ground. The 2024 index introduced a check on "paper parks," protected areas where logging, mining or fishing continue anyway, and found that in 35 countries there is more fishing activity inside marine protected areas than outside them. The cleanest countries earn their place on real reductions, but the ranking is a measure of environmental performance against targets, not a guarantee that every protected acre is actually protected.
Sources & Notes
Composite index that assesses a country's environmental health and ecosystem vitality.
Average concentration of PM2.5 particles in micrograms per cubic meter.