STD Rates By Country

1 | South Africa | 43,985per 100k | |
2 | Botswana | 41,231per 100k | |
3 | Lesotho | 40,573per 100k | |
4 | Malawi | 39,620per 100k | |
5 | Eswatini | 39,003per 100k | |
6 | Namibia | 35,179per 100k | |
7 | Bermuda | 33,266per 100k | |
8 | Brazil | 32,709per 100k | |
9 | Gabon | 32,547per 100k | |
10 | Zimbabwe | 32,379per 100k | |
11 | Barbados | 32,312per 100k | |
12 | British Virgin Islands | 32,180per 100k | |
13 | Puerto Rico | 32,092per 100k | |
14 | Republic of the Congo | 31,846per 100k | |
15 | Zambia | 31,702per 100k | |
16 | Cuba | 31,655per 100k | |
17 | Saint Kitts and Nevis | 31,461per 100k | |
18 | Jamaica | 31,200per 100k | |
19 | Saint Lucia | 31,053per 100k | |
20 | Equatorial Guinea | 30,408per 100k | |
21 | Trinidad and Tobago | 30,339per 100k | |
22 | Antigua and Barbuda | 30,214per 100k | |
23 | Mozambique | 29,970per 100k | |
24 | Comoros | 29,967per 100k | |
25 | Colombia | 29,683per 100k | |
26 | Bahamas | 29,535per 100k | |
27 | Central African Republic | 29,196per 100k | |
28 | Costa Rica | 29,072per 100k | |
29 | Venezuela | 28,909per 100k | |
30 | Dominica | 28,872per 100k | |
31 | Paraguay | 28,798per 100k | |
32 | Djibouti | 28,435per 100k | |
33 | Saint Vincent and the Grenadines | 28,381per 100k | |
34 | Grenada | 28,198per 100k | |
35 | Suriname | 27,799per 100k | |
36 | Kenya | 27,556per 100k | |
37 | Rwanda | 27,362per 100k | |
38 | Honduras | 27,224per 100k | |
39 | Uganda | 27,139per 100k | |
40 | DR Congo | 26,882per 100k | |
41 | Palau | 26,864per 100k | |
42 | Peru | 26,822per 100k | |
43 | Panama | 26,658per 100k | |
44 | Cape Verde | 26,493per 100k | |
45 | Tanzania | 26,341per 100k | |
46 | El Salvador | 26,289per 100k | |
47 | Dominican Republic | 26,250per 100k | |
48 | Angola | 25,933per 100k | |
49 | Guyana | 25,851per 100k | |
50 | Madagascar | 25,809per 100k | |
51 | Cook Islands | 25,656per 100k | |
52 | Thailand | 25,655per 100k | |
53 | Ecuador | 25,627per 100k | |
54 | Northern Mariana Islands | 25,251per 100k | |
55 | South Sudan | 25,224per 100k | |
56 | Niue | 25,156per 100k | |
57 | Nicaragua | 25,140per 100k | |
58 | Bolivia | 25,117per 100k | |
59 | Cameroon | 24,731per 100k | |
60 | Belize | 24,515per 100k | |
61 | Guam | 24,370per 100k | |
62 | Eritrea | 24,005per 100k | |
63 | Burundi | 23,937per 100k | |
64 | Guatemala | 23,869per 100k | |
65 | Fiji | 23,537per 100k | |
66 | Ghana | 23,195per 100k | |
67 | American Samoa | 22,809per 100k | |
68 | Papua New Guinea | 22,791per 100k | |
69 | Mexico | 22,683per 100k | |
70 | Mauritius | 22,509per 100k | |
71 | Somalia | 22,412per 100k | |
72 | Haiti | 22,323per 100k | |
73 | Micronesia | 22,039per 100k | |
74 | Tuvalu | 21,745per 100k | |
75 | Uruguay | 21,597per 100k | |
76 | Maldives | 21,331per 100k | |
77 | Sao Tome and Principe | 21,308per 100k | |
78 | Liberia | 21,262per 100k | |
79 | Chile | 21,225per 100k | |
80 | Marshall Islands | 21,038per 100k | |
81 | Kiribati | 20,911per 100k | |
82 | Seychelles | 20,831per 100k | |
83 | Sri Lanka | 20,829per 100k | |
84 | Togo | 20,828per 100k | |
85 | Ethiopia | 20,786per 100k | |
86 | Nauru | 20,756per 100k | |
87 | Moldova | 20,480per 100k | |
88 | Ivory Coast | 20,472per 100k | |
89 | Guinea Bissau | 20,461per 100k | |
90 | Ukraine | 20,458per 100k | |
91 | United States | 20,433per 100k | |
92 | Argentina | 20,361per 100k | |
93 | Sierra Leone | 19,916per 100k | |
94 | Belarus | 19,845per 100k | |
95 | Latvia | 19,821per 100k | |
96 | Tonga | 19,793per 100k | |
97 | Lithuania | 19,768per 100k | |
98 | Mali | 19,707per 100k | |
99 | Samoa | 19,687per 100k | |
100 | Russia | 19,681per 100k | |
101 | Malaysia | 19,622per 100k | |
102 | Myanmar | 19,604per 100k | |
103 | Estonia | 19,572per 100k | |
104 | Vanuatu | 19,378per 100k | |
105 | Mauritania | 19,354per 100k | |
106 | Vietnam | 19,229per 100k | |
107 | Guinea | 19,209per 100k | |
108 | Nigeria | 19,101per 100k | |
109 | Solomon Islands | 19,061per 100k | |
110 | Burkina Faso | 18,917per 100k | |
111 | Indonesia | 18,853per 100k | |
112 | South Korea | 18,385per 100k | |
113 | Gambia | 18,363per 100k | |
114 | Cambodia | 18,282per 100k | |
115 | Taiwan | 18,253per 100k | |
116 | Senegal | 17,973per 100k | |
117 | Laos | 17,625per 100k | |
118 | Iran | 17,356per 100k | |
119 | Philippines | 17,029per 100k | |
120 | Benin | 16,839per 100k | |
121 | Armenia | 16,577per 100k | |
122 | China | 16,574per 100k | |
123 | North Korea | 16,466per 100k | |
124 | Georgia | 16,409per 100k | |
125 | Morocco | 16,246per 100k | |
126 | Azerbaijan | 16,198per 100k | |
127 | Timor Leste | 16,052per 100k | |
128 | Greenland | 15,881per 100k | |
129 | Bulgaria | 15,786per 100k | |
130 | Saudi Arabia | 15,584per 100k | |
131 | Niger | 15,295per 100k | |
132 | Tunisia | 15,281per 100k | |
133 | Kuwait | 15,253per 100k | |
134 | Chad | 15,200per 100k | |
135 | Germany | 15,081per 100k | |
136 | United Arab Emirates | 15,009per 100k | |
137 | Kyrgyzstan | 14,901per 100k | |
138 | Singapore | 14,896per 100k | |
139 | Qatar | 14,628per 100k | |
140 | Mongolia | 14,539per 100k | |
141 | Netherlands | 14,525per 100k | |
142 | Uzbekistan | 14,516per 100k | |
143 | Australia | 14,474per 100k | |
144 | Sweden | 14,222per 100k | |
145 | Turkmenistan | 13,947per 100k | |
146 | Libya | 13,928per 100k | |
147 | Bahrain | 13,862per 100k | |
148 | Canada | 13,807per 100k | |
148 | Croatia | 13,807per 100k | |
150 | Switzerland | 13,641per 100k | |
151 | Lebanon | 13,581per 100k | |
152 | Portugal | 13,474per 100k | |
153 | Denmark | 13,285per 100k | |
154 | Tajikistan | 13,169per 100k | |
155 | Andorra | 13,111per 100k | |
156 | Monaco | 13,046per 100k | |
157 | Turkey | 12,940per 100k | |
158 | Algeria | 12,889per 100k | |
159 | San Marino | 12,860per 100k | |
160 | North Macedonia | 12,780per 100k | |
161 | Bosnia and Herzegovina | 12,710per 100k | |
162 | Slovakia | 12,707per 100k | |
163 | Oman | 12,689per 100k | |
164 | Romania | 12,630per 100k | |
165 | Iraq | 12,582per 100k | |
166 | Serbia | 12,560per 100k | |
167 | Brunei | 12,492per 100k | |
168 | Malta | 12,481per 100k | |
169 | France | 12,470per 100k | |
170 | Sudan | 12,431per 100k | |
171 | Japan | 12,291per 100k | |
172 | Montenegro | 12,262per 100k | |
173 | Albania | 12,212per 100k | |
174 | Luxembourg | 12,190per 100k | |
175 | Iceland | 12,152per 100k | |
176 | Italy | 12,138per 100k | |
176 | Cyprus | 12,138per 100k | |
178 | Finland | 12,124per 100k | |
179 | Slovenia | 12,119per 100k | |
180 | Belgium | 12,079per 100k | |
181 | Jordan | 12,045per 100k | |
182 | Egypt | 12,033per 100k | |
183 | Spain | 11,978per 100k | |
184 | Norway | 11,916per 100k | |
185 | Syria | 11,861per 100k | |
186 | Poland | 11,698per 100k | |
187 | Greece | 11,605per 100k | |
188 | Czech Republic | 11,575per 100k | |
189 | Ireland | 11,478per 100k | |
190 | New Zealand | 11,412per 100k | |
191 | Austria | 11,340per 100k | |
192 | Palestine | 11,318per 100k | |
193 | India | 11,260per 100k | |
194 | United Kingdom | 11,076per 100k | |
195 | Hungary | 11,046per 100k | |
196 | Bhutan | 10,939per 100k | |
197 | Yemen | 10,248per 100k | |
198 | Bangladesh | 10,140per 100k | |
199 | Nepal | 9,808per 100k | |
200 | Israel | 9,494per 100k | |
201 | Afghanistan | 8,722per 100k | |
202 | Pakistan | 8,052per 100k | |
203 | Kazakhstan | 1,491per 100k |
Last updated March 30, 2026
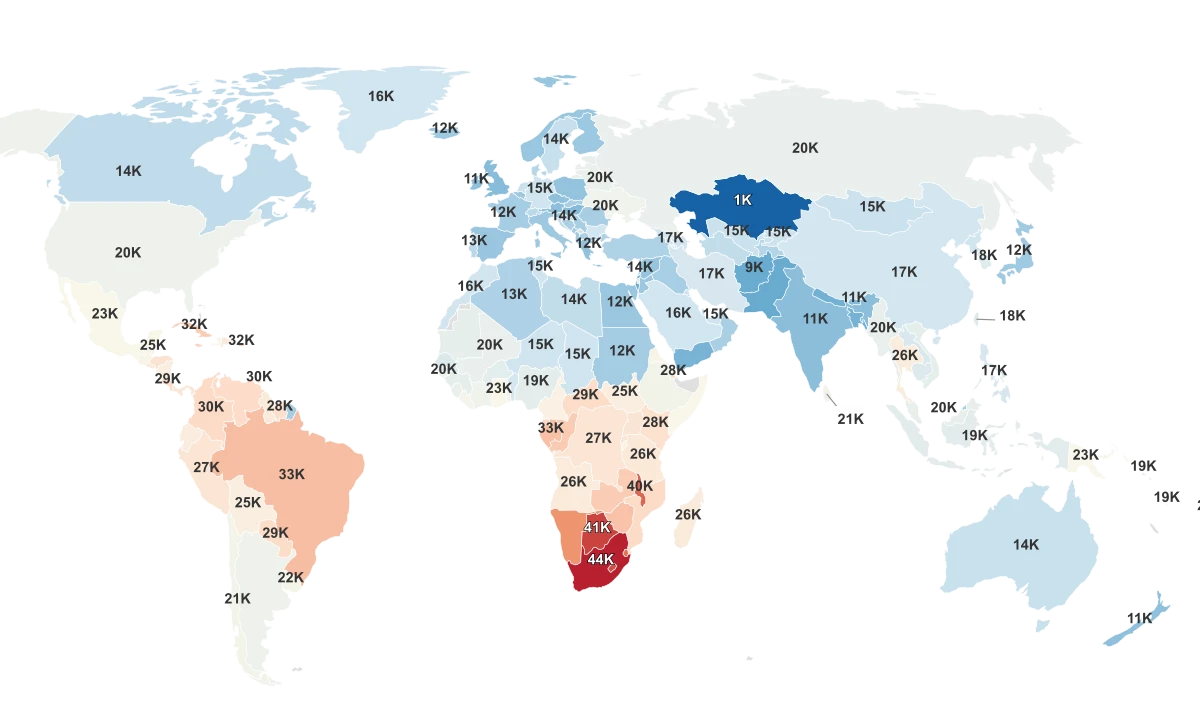
South Africa's STI Rate Is 29 Times Higher Than Kazakhstan's
This ranking tracks estimated sexually transmitted infection cases per 100,000 people in 2021, drawn from Global Burden of Disease data. It is not measuring just HIV, and it is not just counting the cases that showed up at a clinic. The World Health Organization says more than 30 bacteria, viruses, and parasites can be transmitted through sexual contact, and that more than 1 million curable infections are acquired every day worldwide.
The gap from top to bottom is enormous. South Africa sits first at 44.0K cases per 100,000 people. Kazakhstan anchors the last spot at 1.5K. That is a 29-fold difference between the two ends of the table.
The upper tier is not scattered across the globe. South Africa, Botswana (41.2K), and Lesotho (40.6K) fill the first three slots. Right behind them sit Malawi (39.6K), Eswatini (39.0K), and Namibia (35.2K). All six countries share the same belt of southern and eastern Africa.
Below that cluster, the table widens. Bermuda, Brazil, and Barbados all land in the top 12, pulling the Caribbean and Latin America into the picture.
The middle of the table is tightly packed. Most countries cluster around 20,000 cases per 100,000, and the distribution is nearly symmetrical. Strip away the extremes, and the bulk of the world sits far closer to each other than either end sits to the middle.
All Metrics
HIV and STI Burden Overlap, but They Are Not the Same List
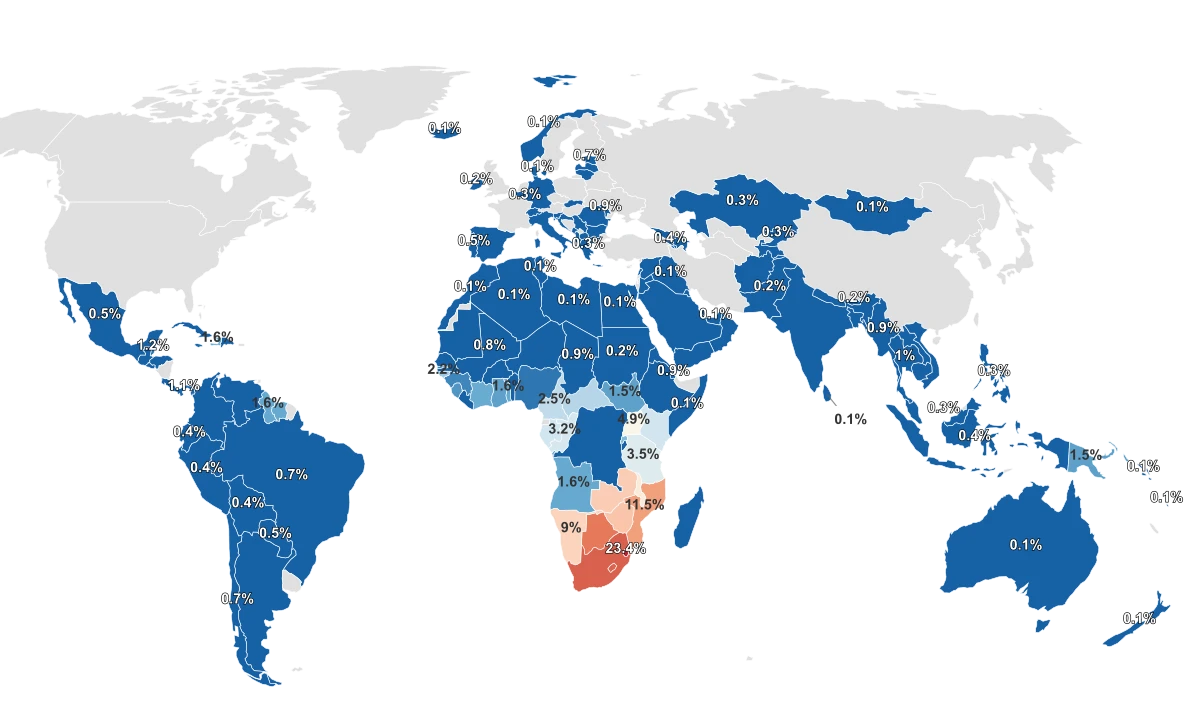
The countries at the top of the STI ranking also crowd the top of the HIV table, and that is not a coincidence. Eswatini leads the world in adult HIV prevalence at 23.4%. South Africa sits second at 17.2%, and Lesotho third at 17.1%. All three also land in the top five for overall STI burden.
The WHO explains part of the connection: herpes, gonorrhoea, and syphilis can raise the risk of acquiring HIV, and HIV in turn weakens immune defenses against other infections. UNAIDS still describes eastern and southern Africa as the region most affected by the HIV pandemic. When one sexually transmitted epidemic runs deep, the others tend to follow.
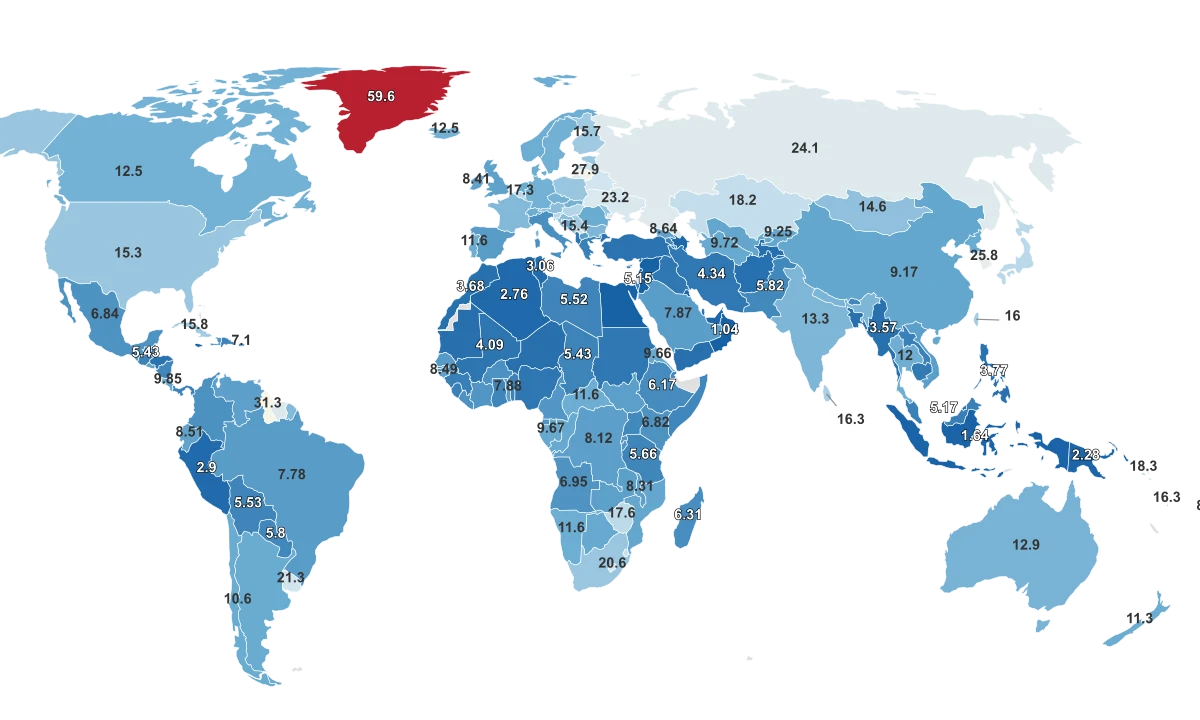
Countries With Higher HIV Prevalence Usually Carry Higher STI Burden
Adult HIV prevalence (2024) tracks broadly with 2021 STI rates per 100,000, especially in southern Africa, though the pattern is far from airtight.
But the two rankings are not interchangeable. Brazil ranks 8th for STI rate at 32.7K while sitting 52nd for HIV prevalence. Its adult HIV rate is just 0.7%, a fraction of southern Africa's. Bermuda ranks 7th for STI burden but does not appear near the top of the HIV table at all. The STI ranking captures a much wider set of infections than HIV alone.
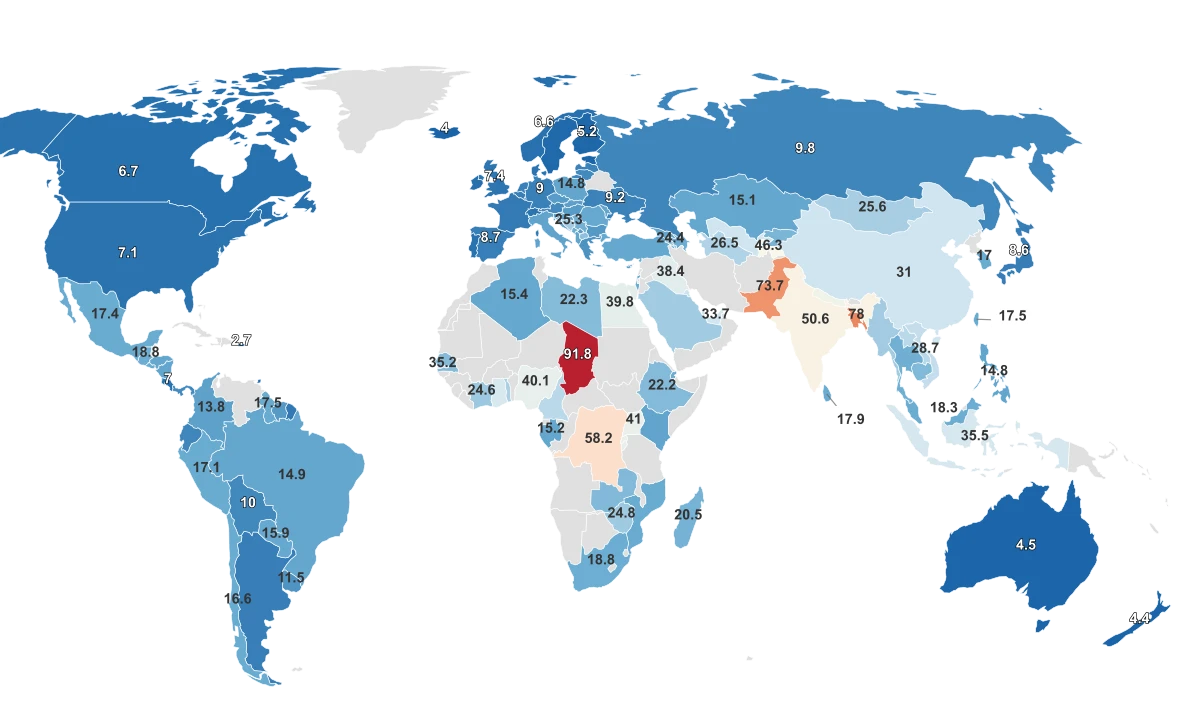
Partner Count and Circumcision Do Not Explain the Map
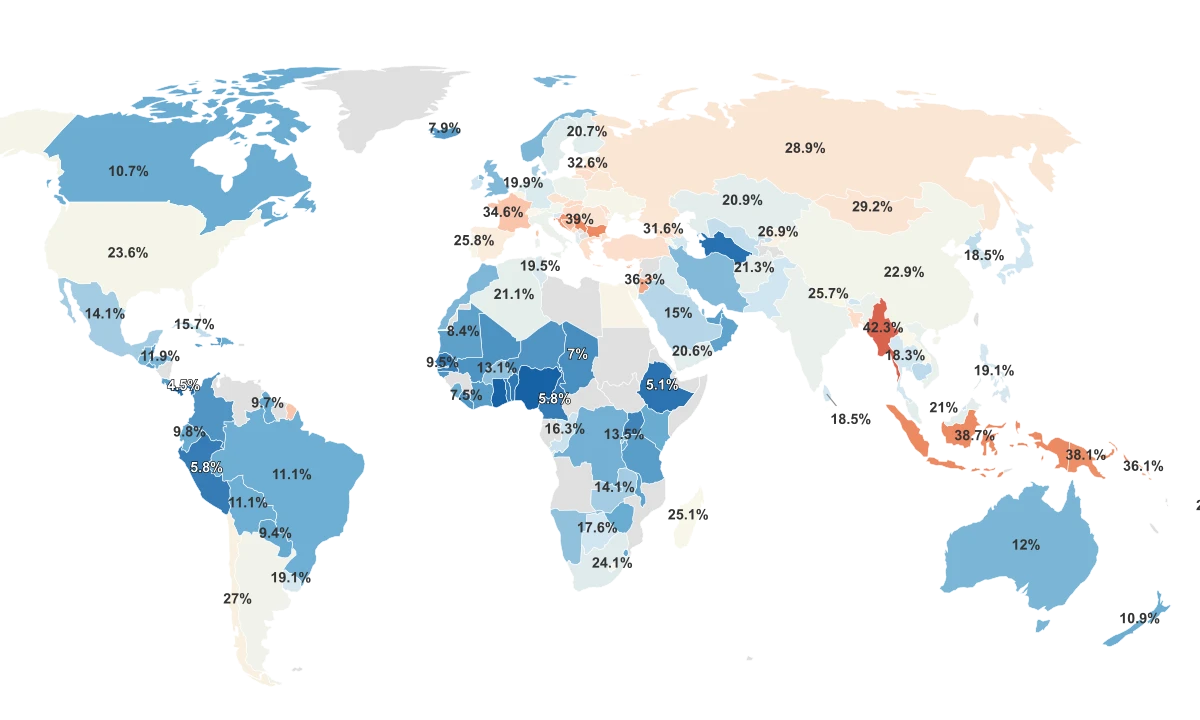
The intuitive explanation is that countries near the top of the ranking simply have more sexual partners. The data does not support that. Turkey reports the highest average number of sexual partners in this dataset at 15, yet it sits 157th for STI rate at 12.9K. That is barely above the bottom third of the table.
That does not mean partner count is irrelevant at the individual level. The CDC lists multiple partners as a risk factor for STI acquisition, but pairs it with condom use, regular testing, and partner treatment. At the country level, what matters is whether infections already circulating get found and treated quickly. A nation with fewer partners but weaker public health infrastructure can carry a heavier burden than one with more partners and better screening.
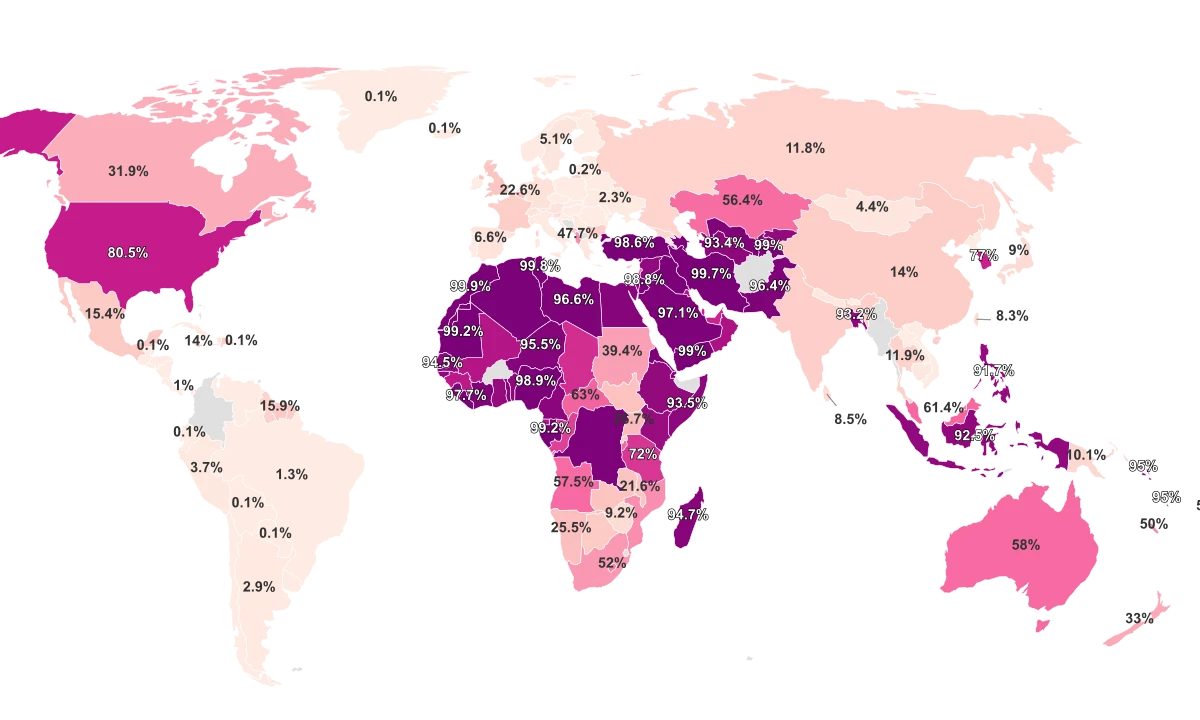
Circumcision tells a similar story. Morocco is nearly universally circumcised at 99.9%, and it sits comfortably in the lower half of the STI table. Gabon also sits above 99% circumcision, yet it ranks 9th for STI rate. The WHO says circumcision reduces men's risk of heterosexually acquired HIV by about 60%, based on three randomized controlled trials. But the agency presents it as one tool inside a broader prevention package, not a blanket defense against all sexually transmitted infections.
Across 193 country pairs, circumcision rate and STI rate show essentially no statistical relationship. The procedure targets one specific transmission pathway for one specific virus. Expecting it to reshape an entire country's STI map is asking more than the biology supports.
The Countries at the Bottom May Just Be the Hardest to Measure
The bottom of this ranking can look reassuring. It should not, at least not without a caveat. The WHO says the global STI burden is difficult to estimate because the majority of curable infections are asymptomatic, molecular diagnostic tests are largely unavailable in low- and middle-income countries, and many health systems still rely on syndromic management that only catches infections with visible symptoms.
That means a low number on this page can reflect genuinely lower transmission, weaker detection, or both. Kazakhstan at 1.5K sits more than two and a half standard deviations below the dataset's mean, making it a massive statistical outlier at the low end. Whether that reflects a real epidemiological reality or a measurement gap is a question the data alone cannot answer.
The same caution applies to the secondary metrics. HIV prevalence data comes from 2024, while circumcision estimates date to 2016. The partner-count metric covers only 46 of the 203 countries in the STI ranking and relies on self-reported survey data, which the CDC notes is shaped by social desirability bias. So the safest conclusions are the broadest ones. Southern Africa carries a disproportionate STI burden, and HIV helps explain that cluster. Neither sexual behavior nor circumcision alone accounts for where a country lands on the map.
Sources & Notes
Number of reported sexually transmitted disease cases per 100,000 people.
% of people infected with HIV.
Average number of sexual partners for individuals.
% of adult males that are circumcised.