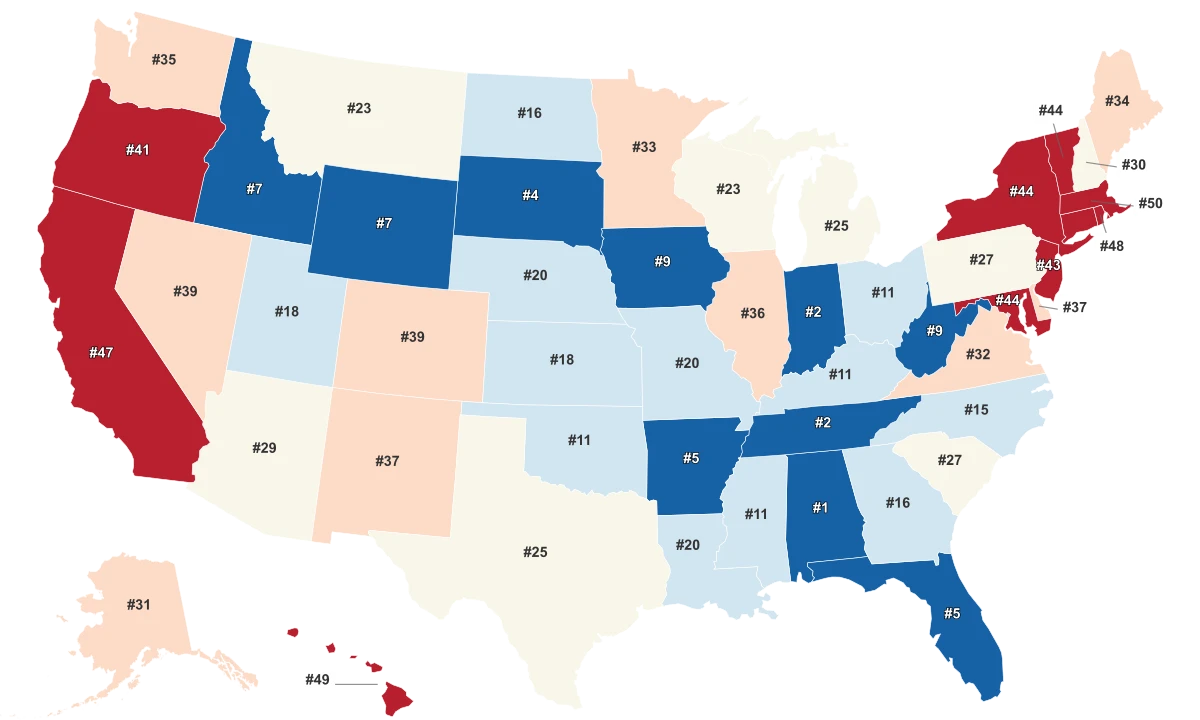
Delegate Count by State

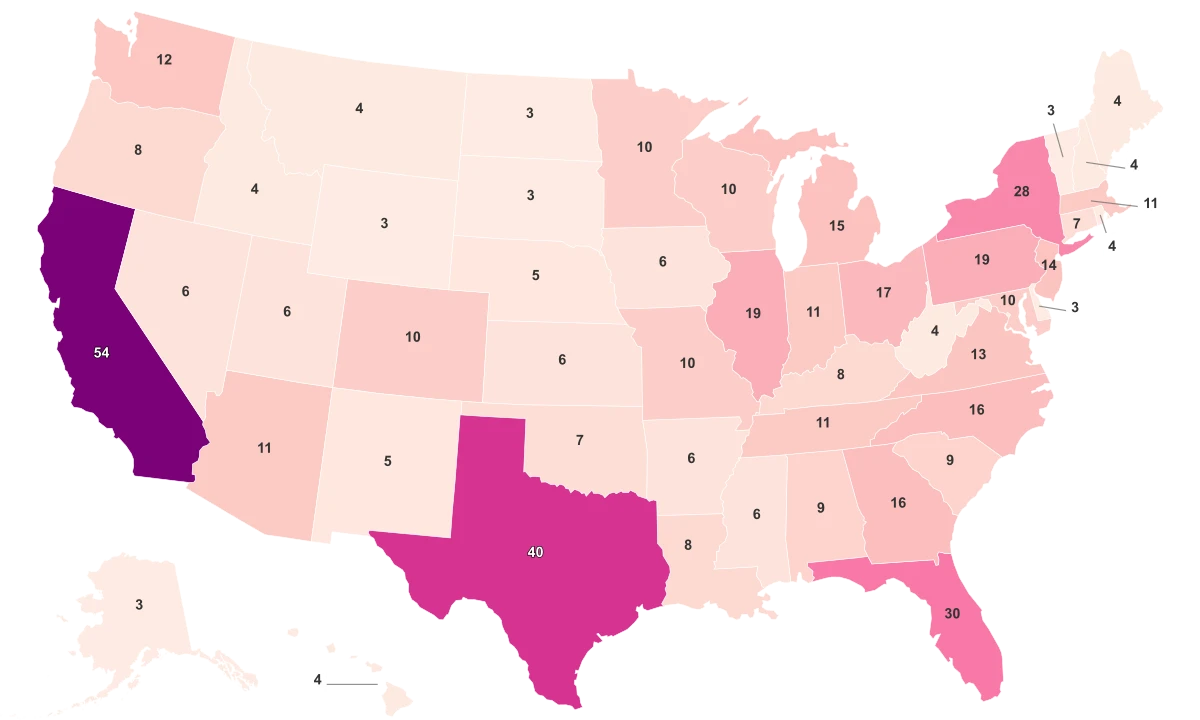
1 | California | 54 | |
2 | Texas | 40 | |
3 | Florida | 30 | |
4 | New York | 28 | |
5 | Pennsylvania | 19 | |
5 | Illinois | 19 | |
7 | Ohio | 17 | |
8 | North Carolina | 16 | |
8 | Georgia | 16 | |
10 | Michigan | 15 | |
11 | New Jersey | 14 | |
12 | Virginia | 13 | |
13 | Washington | 12 | |
14 | Indiana | 11 | |
14 | Tennessee | 11 | |
14 | Massachusetts | 11 | |
14 | Arizona | 11 | |
18 | Missouri | 10 | |
18 | Maryland | 10 | |
18 | Minnesota | 10 | |
18 | Colorado | 10 | |
18 | Wisconsin | 10 | |
23 | Alabama | 9 | |
23 | South Carolina | 9 | |
25 | Louisiana | 8 | |
25 | Oregon | 8 | |
25 | Kentucky | 8 | |
28 | Oklahoma | 7 | |
28 | Connecticut | 7 | |
30 | Mississippi | 6 | |
30 | Utah | 6 | |
30 | Nevada | 6 | |
30 | Kansas | 6 | |
30 | Iowa | 6 | |
30 | Arkansas | 6 | |
36 | Nebraska | 5 | |
36 | New Mexico | 5 | |
38 | Hawaii | 4 | |
38 | Maine | 4 | |
38 | Montana | 4 | |
38 | Rhode Island | 4 | |
38 | West Virginia | 4 | |
38 | New Hampshire | 4 | |
38 | Idaho | 4 | |
45 | Delaware | 3 | |
45 | Wyoming | 3 | |
45 | South Dakota | 3 | |
45 | Alaska | 3 | |
45 | District of Columbia | 3 | |
45 | North Dakota | 3 | |
45 | Vermont | 3 |
Last updated February 28, 2026
How Delegates Are Distributed Across the U.S.
In U.S. presidential elections, each state’s delegate count determines how much influence it wields in both party primaries and the general election. Delegates fall into two broad categories:
- Pledged delegates, who represent each party’s voters during the Democratic and Republican nomination processes.
- Electoral votes, which decide the presidency in the Electoral College.
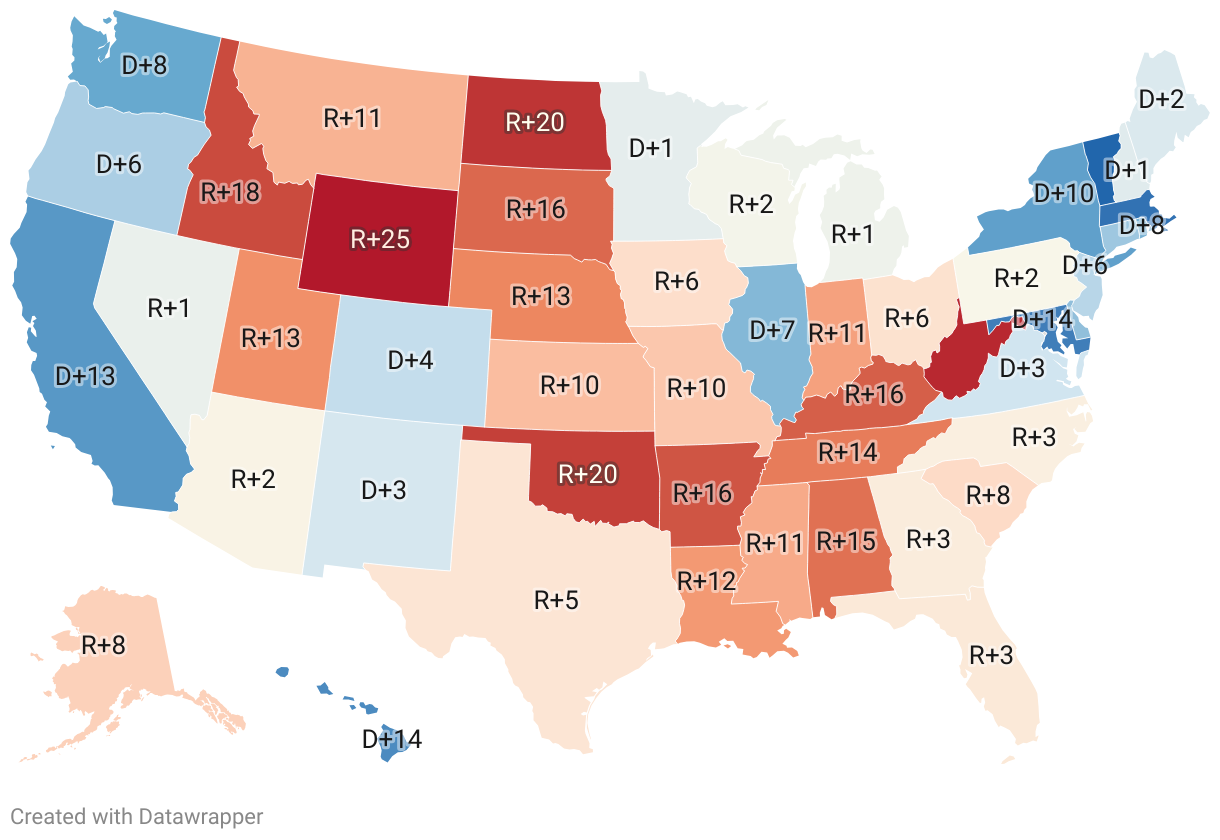
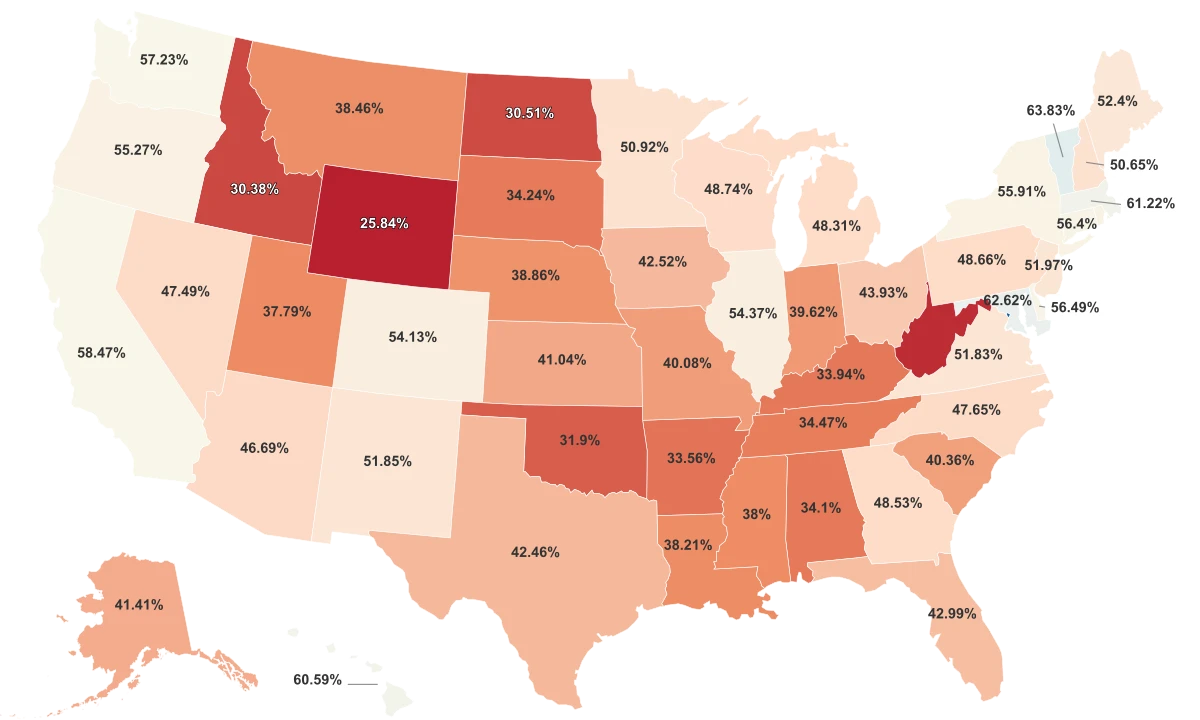
Each party allocates delegates differently. The Democratic Party uses a proportional system based on primary and caucus results, while the Republican Party allows more variation, with some states assigning delegates proportionally and others using a winner-take-all approach. In both cases, delegate totals are tied to population size, congressional representation, and past voting performance.
In total, the number of electoral delegates each state holds corresponds to its U.S. House seats plus two Senate seats, adjusted every decade through the Census. This is why populous states such as California, Texas, and Florida dominate delegate counts, while smaller states like Vermont and Wyoming maintain the minimum representation guaranteed by federal structure.
Between 2020 and 2024, modest shifts occurred as population changes and party rule revisions reshaped counts.
- California and Texas gained delegates after reapportionment and party formula adjustments.
- Midwestern and Rust Belt states, including Ohio and Michigan, saw small changes following demographic stagnation.
- Swing states like Georgia, Pennsylvania, and Arizona remain central to both parties, combining large delegate totals with unpredictable voting outcomes.
Why Delegate Counts Matter
Delegate totals reflect how much influence each state has in the presidential process, both in selecting party nominees and in the general election. When a state holds a large number of delegates, candidates must campaign more heavily there, making it a strategic priority.
For example, the large delegations in states like California and Texas force candidates to build broad coalitions that can resonate nationally. On the flip side, smaller states still play outsized roles through early primaries or caucuses. The number and allocation of delegates also affect how parties organize their nomination rules and how presidential hopefuls manage momentum.
All Metrics
| Region ↕ | Electoral Votes↕ | Total Electoral Delegates 2024↕ | US House Representatives Count↕ | Cook Partisan Voter Index 2020↕ |
|---|---|---|---|---|
| California | ||||
| Texas | ||||
| Florida | ||||
| New York | ||||
| Pennsylvania | ||||
| Illinois | ||||
| Ohio | ||||
| North Carolina | ||||
| Georgia | ||||
| Michigan | ||||
| New Jersey | ||||
| Virginia | ||||
| Washington | ||||
| Indiana | ||||
| Tennessee | ||||
| Massachusetts | ||||
| Arizona | ||||
| Missouri | ||||
| Maryland | ||||
| Minnesota | ||||
| Colorado | ||||
| Wisconsin | ||||
| Alabama | ||||
| South Carolina | ||||
| Louisiana | ||||
| Oregon | ||||
| Kentucky | ||||
| Oklahoma | ||||
| Connecticut | ||||
| Mississippi | ||||
| Utah | ||||
| Nevada | ||||
| Kansas | ||||
| Iowa | ||||
| Arkansas | ||||
| Nebraska | ||||
| New Mexico | ||||
| Hawaii | ||||
| Maine | ||||
| Montana | ||||
| Rhode Island | ||||
| West Virginia | ||||
| New Hampshire | ||||
| Idaho | ||||
| Delaware | ||||
| Wyoming | ||||
| South Dakota | ||||
| Alaska | ||||
| District of Columbia | ||||
| North Dakota | ||||
| Vermont |
Key Findings
- California leads the nation with 664 total electoral delegates, reflecting its vast population and congressional weight.
- Texas ranks 2nd (433) and New York 3rd (398), cementing their dominance in both party primaries and the Electoral College.
- Florida (379) and Pennsylvania (254) complete the top five — both key battlegrounds in recent election cycles.
- The 10 most populous states together control nearly half of all U.S. delegates, underscoring how political influence concentrates in large states.
- Republican allocations tend to favor winner-take-all or hybrid models, while Democratic distributions remain proportional, making delegate math crucial in tight primaries.
- Vermont has the smallest total with 41 delegates, followed by Wyoming and North Dakota (46 each) — all three states with only 3 electoral votes.
- Delegate totals evolved only slightly from 2020 to 2024, with notable increases in California (+77) and Texas (+50).
States with the Highest Delegate Counts
California ranks 1st with 664 total delegates, leading across all categories — 54 electoral votes, 424 Democratic delegates, and 169 Republican delegates. Texas follows 2nd with 433, also 2nd in electoral votes (40) and Republican delegates (161), and 3rd among Democrats (244). New York ranks 3rd with 398, 4th in electoral votes (28), 2nd in Democratic delegates (268), and 4th in Republican delegates (91). Florida places 4th at 379, ranking 3rd in electoral votes (30) and 4th in Democratic delegates (224). Pennsylvania holds 5th with 254 delegates, 5th in Democratic count (159). Illinois ranks 6th (241), 6th in Republican delegates (64) and top ten in Democratic (147). Ohio ranks 7th with 223, 6th in Democratic delegates (127) and 8th in Republican (79). North Carolina follows 8th (208), 9th in Democratic (116) and 7th in Republican (74). Michigan is 9th (193), 8th in Democratic (117), while Georgia completes the top ten with 182, 10th in Democratic (108) and 10th in Republican (59).
Top 10 States by Total Electoral Delegates
| State | Total Delegates | Electoral Votes | Democratic Delegates | Republican Delegates |
|---|---|---|---|---|
| California | 664 | 54 | 424 | 169 |
| Texas | 433 | 40 | 244 | 161 |
| New York | 398 | 28 | 268 | 91 |
| Florida | 379 | 30 | 224 | 125 |
| Pennsylvania | 254 | 19 | 159 | 16 |
| Illinois | 241 | 19 | 147 | 64 |
| Ohio | 223 | 17 | 127 | 79 |
| North Carolina | 208 | 16 | 116 | 74 |
| Michigan | 193 | 15 | 117 | 55 |
| Georgia | 182 | 16 | 108 | 59 |
Sources & Notes
A measurement of how partisan a U.S.