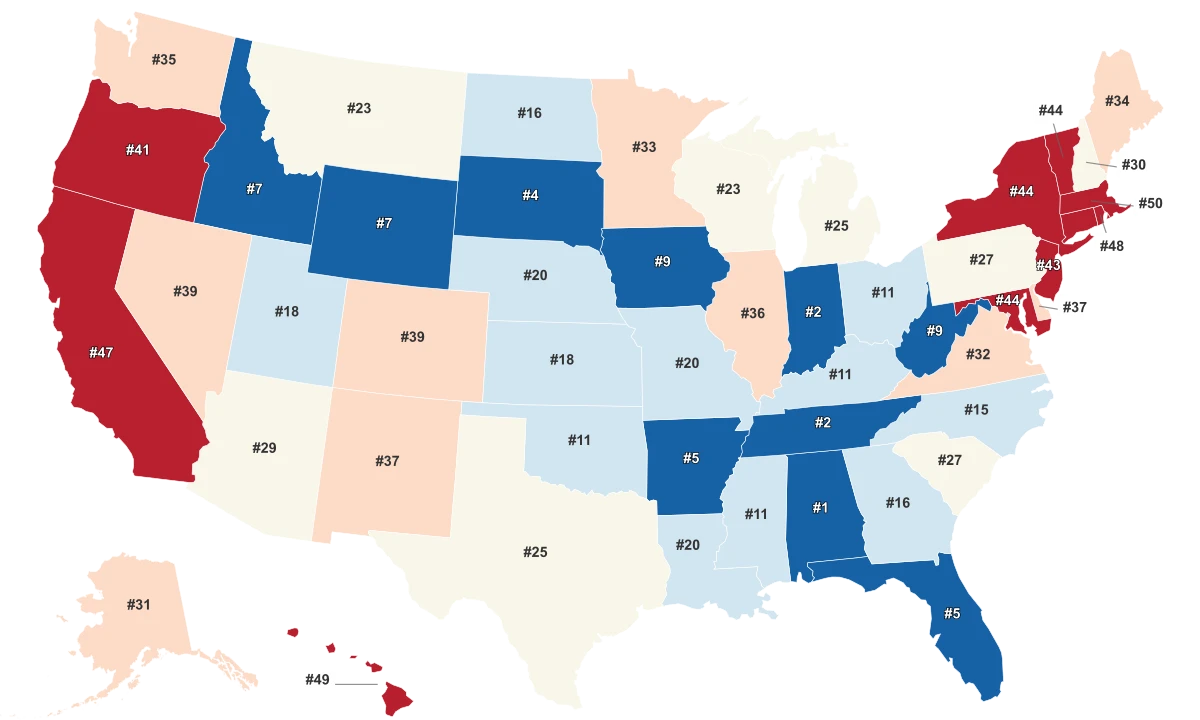
Blue States

1 | Vermont | 16 | |
2 | Massachusetts | 15 | |
3 | Hawaii | 14 | |
3 | Maryland | 14 | |
5 | California | 13 | |
6 | New York | 10 | |
7 | Washington | 8 | |
7 | Rhode Island | 8 | |
9 | Delaware | 7 | |
9 | Connecticut | 7 | |
9 | Illinois | 7 | |
12 | New Jersey | 6 | |
12 | Oregon | 6 | |
14 | Colorado | 4 | |
15 | Virginia | 3 | |
15 | New Mexico | 3 | |
17 | Maine | 2 | |
18 | Minnesota | 1 | |
18 | New Hampshire | 1 | |
20 | Nevada | -1 | |
20 | Michigan | -1 | |
22 | Pennsylvania | -2 | |
22 | Arizona | -2 | |
22 | Wisconsin | -2 | |
25 | Florida | -3 | |
25 | North Carolina | -3 | |
25 | Georgia | -3 | |
28 | Texas | -5 | |
29 | Iowa | -6 | |
29 | Ohio | -6 | |
31 | Alaska | -8 | |
31 | South Carolina | -8 | |
33 | Missouri | -10 | |
33 | Kansas | -10 | |
35 | Mississippi | -11 | |
35 | Indiana | -11 | |
35 | Montana | -11 | |
38 | Louisiana | -12 | |
39 | Nebraska | -13 | |
39 | Utah | -13 | |
41 | Tennessee | -14 | |
42 | Alabama | -15 | |
43 | South Dakota | -16 | |
43 | Kentucky | -16 | |
43 | Arkansas | -16 | |
46 | Idaho | -18 | |
47 | Oklahoma | -20 | |
47 | North Dakota | -20 | |
49 | West Virginia | -22 | |
50 | Wyoming | -25 |
Last updated February 28, 2026
Introduction
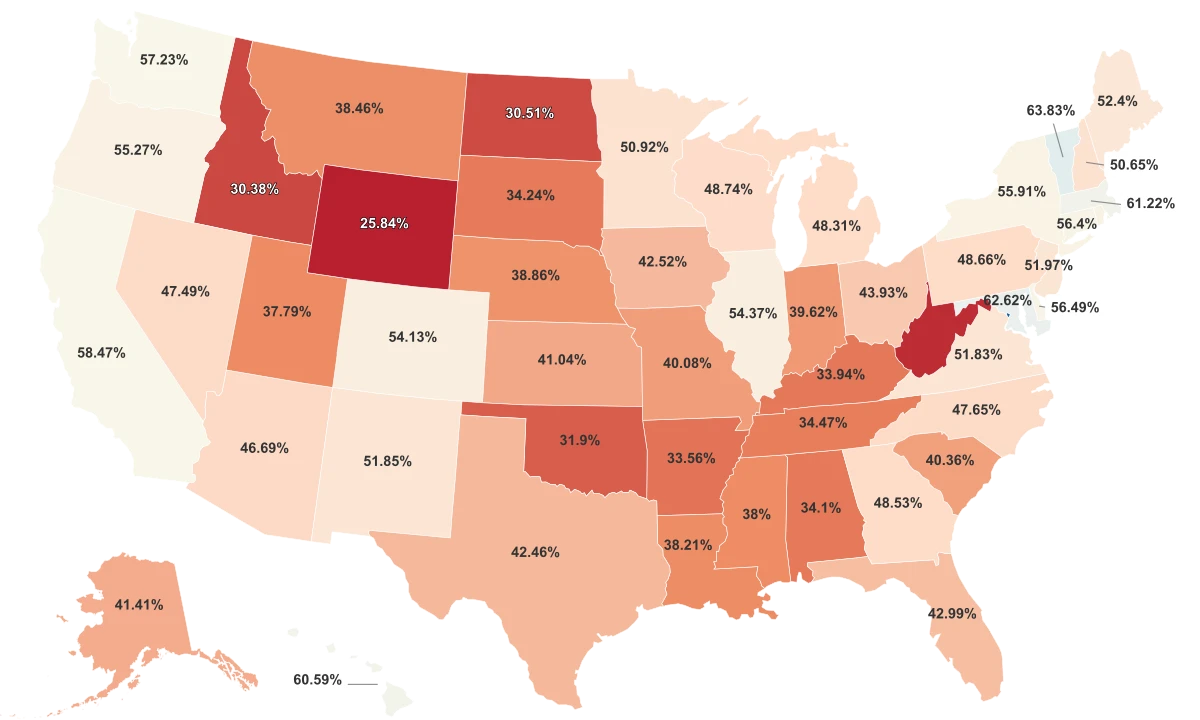
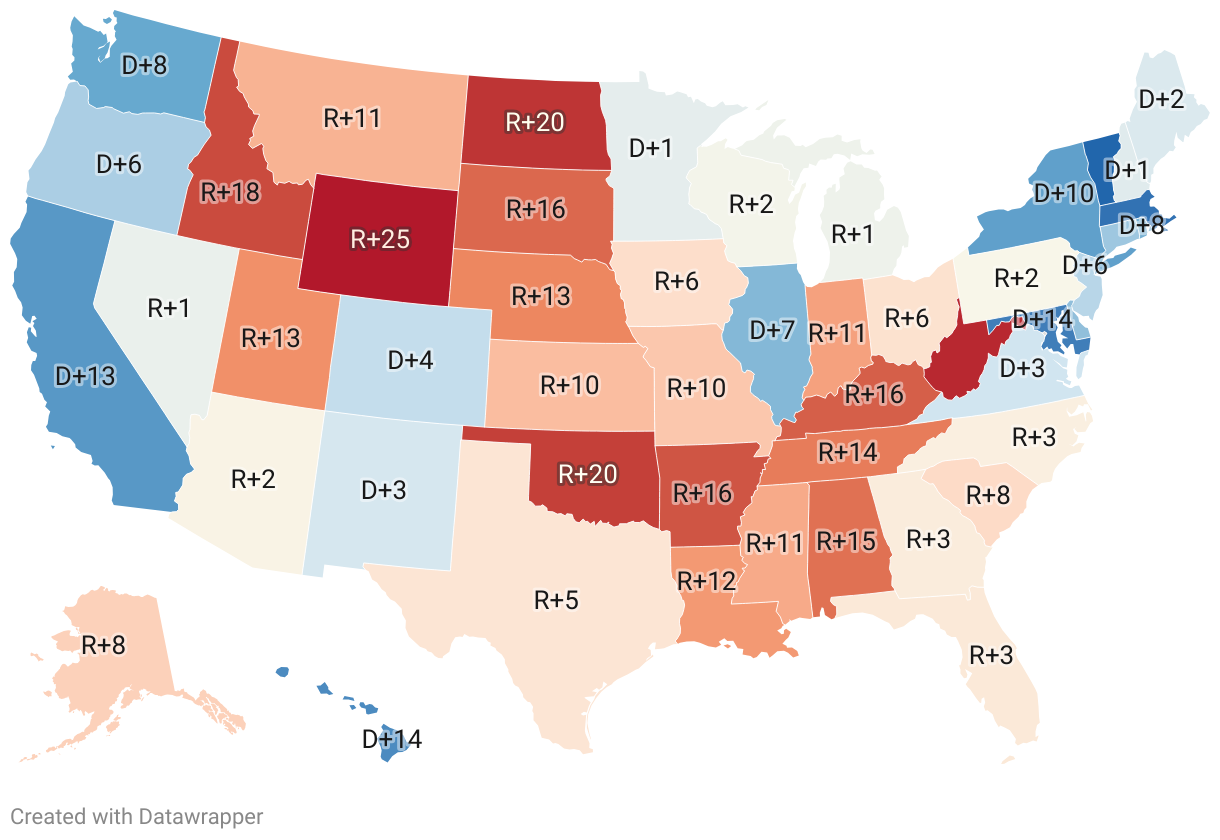
In the American political landscape, the terms "blue states" and "red states" have become an integral part of the lexicon, denoting the general political leanings of individual state populations. Historically, a blue state indicates one with a predilection towards the Democratic Party, while a red state signifies those who lean more towards the Republican Party. This dichotomy, largely consolidated during media coverage of the 2000 presidential election, has remained pervasive ever since. However, this division isn't absolute, and the intensity of each state's political leaning differs from place to place. The Cook Partisan Voting Index (PVI) assists us in understanding these variations, with the index indicating the degree to which a state or congressional district leans towards Democrats or Republicans compared to the country as a whole. Here, the color-coded Democratic Voting Index gives us a comprehensive view of the political tilt of each State. States with a positive D score sway toward the Democratic Party, and States with a R score lean toward the Republican Party.
- Vermont tops the list of blue states with a remarkable D+16, meaning it votes 16 percentage points more Democratic than the country average. This is followed by Massachusetts and Hawaii at D+15 and D+14, respectively, indicating significant Democratic leanings in these states.
- There is a clear shift in leaning as we move down the list. The tipping point is Michigan, ranked 20th, which leans slightly towards the Republican Party with R+1. This suggests Michigan is a borderline state or "swing state," wherein both the Democratic and Republican parties receive strong levels of support and the state's allegiance can swing from one election to another.
- Most "blue states" are concentrated in the Northeast and the West Coast, with Vermont, Massachusetts, New York, and Maryland in the Northeast, and California, Oregon, and Washington on the West Coast.
All Metrics
| Region ↕ | Cook Partisan Voter Index 2020↕ | Harris Votes 2024↕ | Democratic Registration 2024↕ | Governor Political Party 2024↕ |
|---|---|---|---|---|
| Vermont | D+16 | |||
| Massachusetts | D+15 | |||
| Hawaii | D+14 | |||
| Maryland | D+14 | |||
| California | D+13 | |||
| New York | D+10 | |||
| Washington | D+8 | |||
| Rhode Island | D+8 | |||
| Delaware | D+7 | |||
| Connecticut | D+7 | |||
| Illinois | D+7 | |||
| New Jersey | D+6 | |||
| Oregon | D+6 | |||
| Colorado | D+4 | |||
| Virginia | D+3 | |||
| New Mexico | D+3 | |||
| Maine | D+2 | |||
| Minnesota | D+1 | |||
| New Hampshire | D+1 | |||
| Nevada | R+1 | |||
| Michigan | R+1 | |||
| Pennsylvania | R+2 | |||
| Arizona | R+2 | |||
| Wisconsin | R+2 | |||
| Florida | R+3 | |||
| North Carolina | R+3 | |||
| Georgia | R+3 | |||
| Texas | R+5 | |||
| Iowa | R+6 | |||
| Ohio | R+6 | |||
| Alaska | R+8 | |||
| South Carolina | R+8 | |||
| Missouri | R+10 | |||
| Kansas | R+10 | |||
| Mississippi | R+11 | |||
| Indiana | R+11 | |||
| Montana | R+11 | |||
| Louisiana | R+12 | |||
| Nebraska | R+13 | |||
| Utah | R+13 | |||
| Tennessee | R+14 | |||
| Alabama | R+15 | |||
| South Dakota | R+16 | |||
| Kentucky | R+16 | |||
| Arkansas | R+16 | |||
| Idaho | R+18 | |||
| Oklahoma | R+20 | |||
| North Dakota | R+20 | |||
| West Virginia | R+22 | |||
| Wyoming | R+25 |
Sources & Notes
A measurement of how partisan a U.S.