Circumcision Rate by State

1 | West Virginia | 91% | |
2 | Kentucky | 86% | |
3 | Ohio | 84% | |
3 | Michigan | 84% | |
5 | Indiana | 83% | |
6 | Iowa | 81% | |
6 | Wisconsin | 81% | |
8 | Pennsylvania | 79% | |
9 | Hawaii | 77% | |
9 | South Dakota | 77% | |
9 | North Dakota | 77% | |
12 | New Hampshire | 76% | |
13 | Missouri | 75% | |
13 | Oklahoma | 75% | |
13 | Nebraska | 75% | |
13 | Rhode Island | 75% | |
17 | Virginia | 74% | |
17 | Tennessee | 74% | |
19 | Wyoming | 73% | |
19 | Kansas | 73% | |
21 | South Carolina | 72% | |
21 | Georgia | 72% | |
23 | Connecticut | 71% | |
24 | Maine | 70% | |
25 | Vermont | 67% | |
25 | Arkansas | 67% | |
27 | Maryland | 66% | |
28 | New Jersey | 65% | |
28 | Massachusetts | 65% | |
30 | Illinois | 63% | |
31 | Minnesota | 59% | |
32 | New York | 58% | |
33 | Colorado | 56% | |
34 | Texas | 51% | |
35 | Montana | 50% | |
35 | North Carolina | 50% | |
37 | New Mexico | 47% | |
38 | Louisiana | 45% | |
39 | Utah | 33% | |
40 | Florida | 31% | |
41 | California | 23% | |
42 | Oregon | 17% | |
43 | Arizona | 16% | |
44 | Washington | 10% | |
44 | Nevada | 10% |
Last updated March 30, 2026
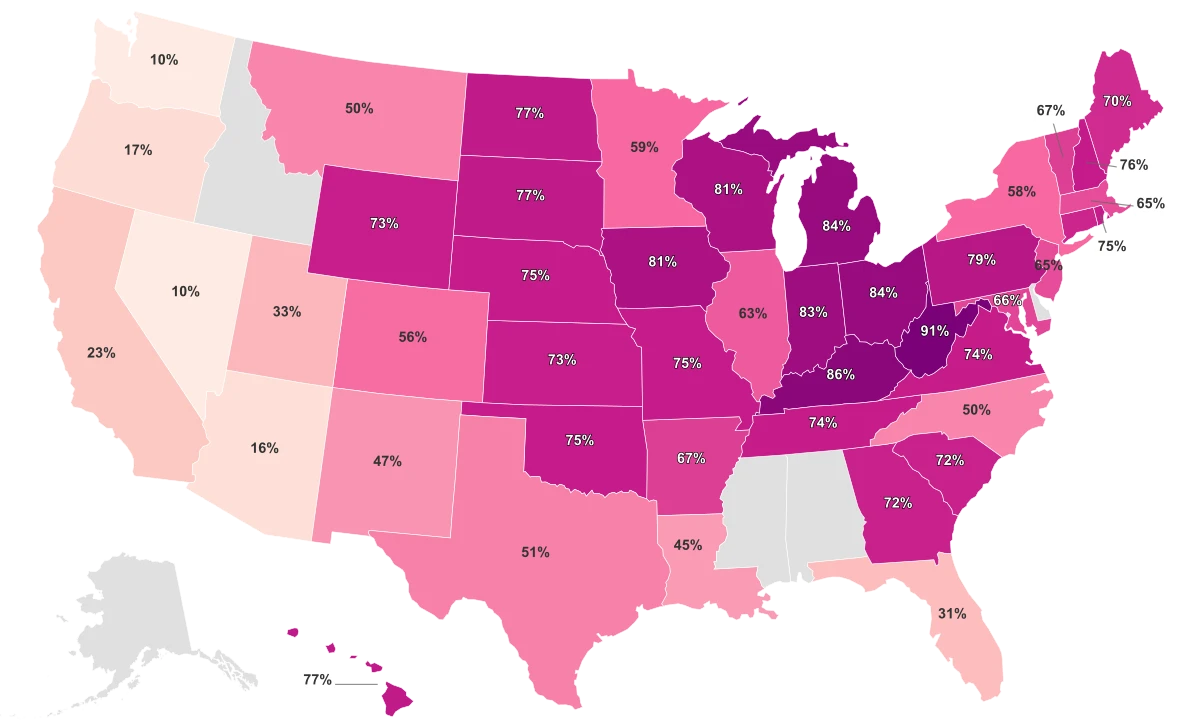
Your State Decided Before You Did
Whether an American male is circumcised depends, more than almost any other factor, on where he was born. West Virginia leads the country at 91%. Washington and Nevada sit at the bottom at 10%. That is a nine-to-one ratio between two states in the same country, for a procedure that most people assume is a simple personal choice.
The divide cuts cleanly along regional lines. The Midwest averages 76%, the Northeast 69.6%, and the South 65.7%. The West averages just 37.5%, less than half the Midwestern rate. The data comes from 2015 estimates of adult male circumcision prevalence across 45 states, and it reflects the cumulative result of decades of newborn decisions, not just recent trends.
Most of the country clusters between 65% and 91%. But a handful of Western states break sharply from the pack: Oregon (17%), Arizona (16%), Washington (10%), and Nevada (10%). Nothing on the high end comes close to that kind of drop-off. The question is why a few states sit so far below everyone else, and the answer has less to do with personal preference than with two structural forces: Medicaid policy and demographics.
All Metrics
| Region ↕ | Circumcision Rate 2015↕ | Hispanic Population % 2023↕ | Asian Population % 2020↕ |
|---|---|---|---|
| West Virginia | 91% | ||
| Kentucky | 86% | ||
| Ohio | 84% | ||
| Michigan | 84% | ||
| Indiana | 83% | ||
| Iowa | 81% | ||
| Wisconsin | 81% | ||
| Pennsylvania | 79% | ||
| Hawaii | 77% | ||
| South Dakota | 77% | ||
| North Dakota | 77% | ||
| New Hampshire | 76% | ||
| Missouri | 75% | ||
| Oklahoma | 75% | ||
| Nebraska | 75% | ||
| Rhode Island | 75% | ||
| Virginia | 74% | ||
| Tennessee | 74% | ||
| Wyoming | 73% | ||
| Kansas | 73% | ||
| South Carolina | 72% | ||
| Georgia | 72% | ||
| Connecticut | 71% | ||
| Maine | 70% | ||
| Vermont | 67% | ||
| Arkansas | 67% | ||
| Maryland | 66% | ||
| New Jersey | 65% | ||
| Massachusetts | 65% | ||
| Illinois | 63% | ||
| Minnesota | 59% | ||
| New York | 58% | ||
| Colorado | 56% | ||
| Texas | 51% | ||
| Montana | 50% | ||
| North Carolina | 50% | ||
| New Mexico | 47% | ||
| Louisiana | 45% | ||
| Utah | 33% | ||
| Florida | 31% | ||
| California | 23% | ||
| Oregon | 17% | ||
| Arizona | 16% | ||
| Washington | 10% | ||
| Nevada | 10% |
The States That Stopped Paying for It
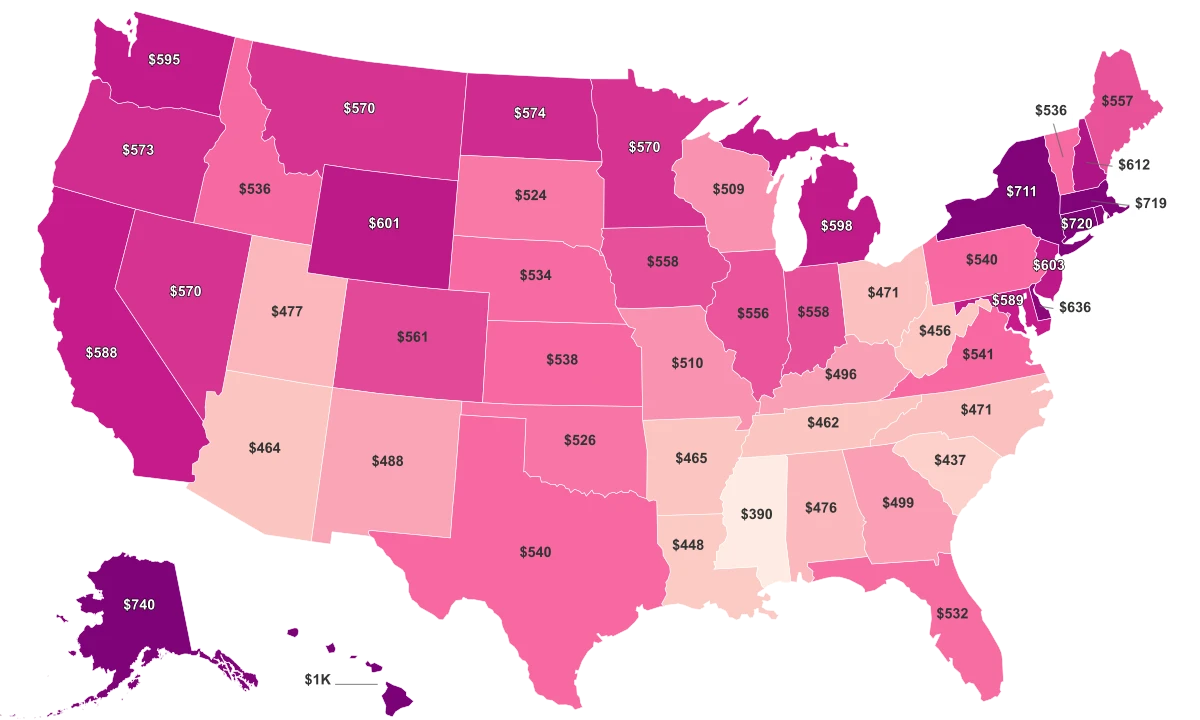
The single clearest policy lever in this ranking is Medicaid. As of 2011, 17 states had stopped covering routine neonatal circumcision through their Medicaid programs. The result was immediate and measurable. Research published through the National Institutes of Health found that states which dropped coverage saw circumcision rates among Medicaid beneficiaries fall by an average of 21.4 percentage points. Among privately insured families in the same states, the decline was just 3.2 points.
California was one of the first states to defund, dropping Medicaid coverage for the procedure in 1982. Today, California's adult circumcision rate is 23%. Oregon and Washington followed with their own defunding decisions, and they sit at 17% and 10% respectively. Florida cut coverage in 2003, and Colorado in 2011. Florida now reports a rate of 31%, one of the lowest in the South.
The financial barrier matters because circumcision is an elective procedure. It typically costs between $200 and $400 at a hospital. For families on Medicaid, that is a meaningful expense for something no medical authority describes as mandatory. A 2012 analysis published in Health Affairs found that hospitals in states where Medicaid covered the procedure had significantly higher circumcision rates than hospitals in states that did not.
The Midwest tells the opposite story. Every state in the top tier of this ranking, including Ohio (84%), Michigan (84%), Indiana (83%), Iowa (81%), and Wisconsin (81%), covers neonatal circumcision through its Medicaid program. The procedure is routine in these states' hospital systems, and financial barriers for low-income families effectively do not exist.
Why Demographics Explain More Than Policy Alone
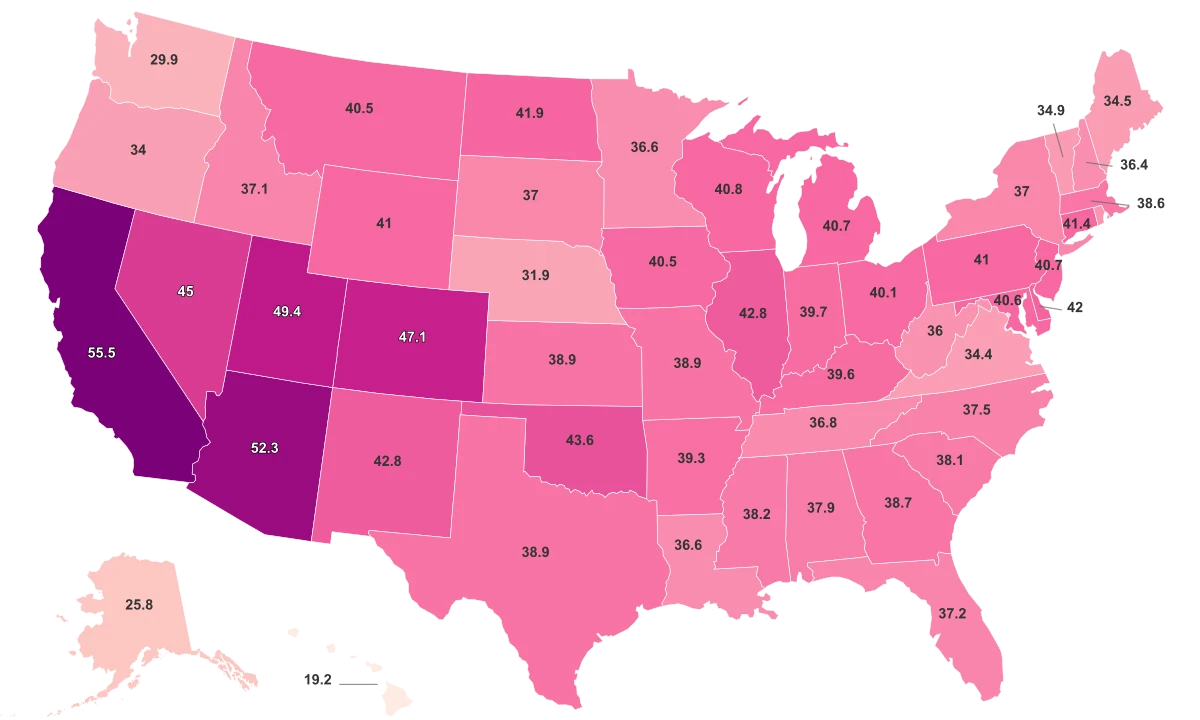
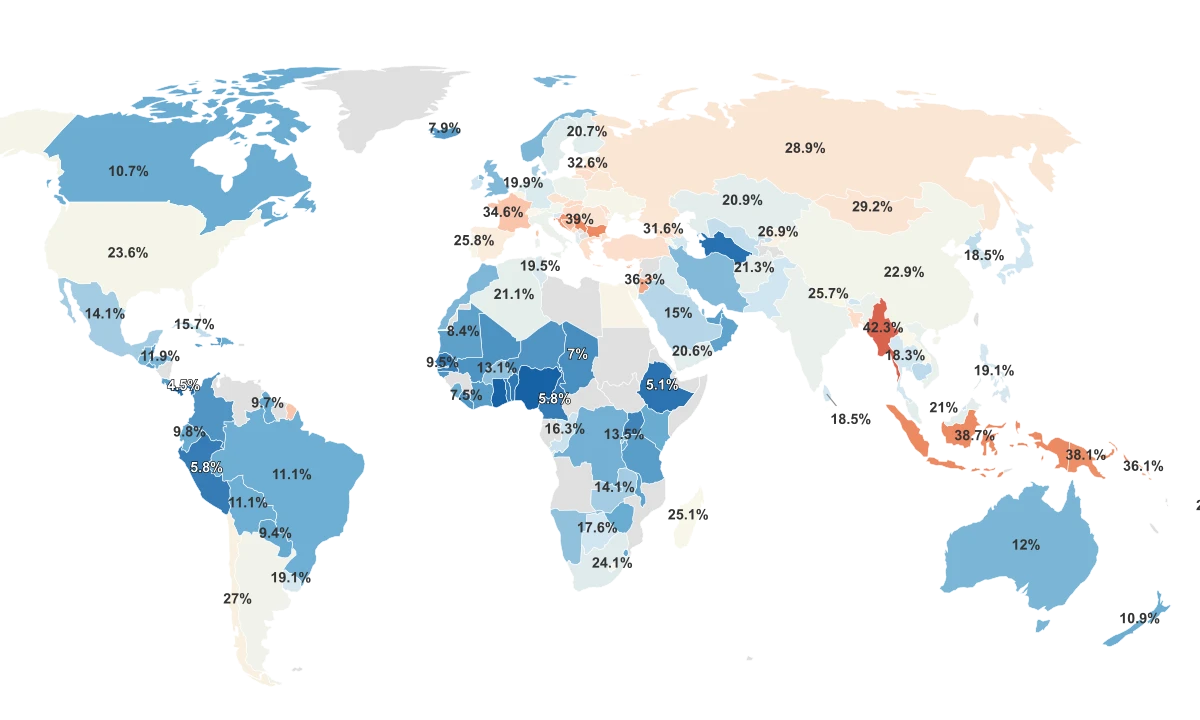
Medicaid policy explains a lot, but it does not explain everything. The strongest statistical relationship in this dataset is between a state's circumcision rate and its Hispanic population share. The two metrics move in opposite directions with a strong negative relationship.
The pattern is visible at the extremes. New Mexico has the largest Hispanic population share in the country at 46.7% and a circumcision rate of 47%. California is 39.3% Hispanic with a 23% circumcision rate. Texas is 36.7% Hispanic with a rate of 51%. At the other end, West Virginia is just 2.0% Hispanic and leads the ranking at 91%.
States With Larger Hispanic Populations Have Lower Circumcision Rates
The relationship holds across all 45 states with data, driven by Latin American cultural norms where routine circumcision is not a standard practice.
The reason is cultural, not economic. In most Latin American countries, routine male circumcision is simply not practiced. Research published through the National Institutes of Health found that the Hispanic neonatal circumcision rate in the United States hovers around 21%, the lowest of any major ethnic group. That rate has remained stable over the past decade even as rates among non-Hispanic white newborns have declined.
This demographic factor compounds the Medicaid effect in the West. The Western states have both the highest Hispanic population shares (regional average: 19.3%) and the most Medicaid defunding. The Midwest has the smallest Hispanic population shares (regional average: 8.0%) and intact Medicaid coverage. The 39-point gap in circumcision rates between the two regions reflects those overlapping forces.
What the Numbers Do Not Capture
This ranking measures the estimated share of adult males who are circumcised, not the current rate of newborn circumcisions. That distinction matters. The 91% figure in West Virginia reflects decisions made across multiple generations. Current neonatal rates nationally have been declining: a 2025 Johns Hopkins analysis of hospital data from 2012 to 2022 found that the overall neonatal circumcision prevalence dropped from roughly 54% to 49%.
The data source itself warrants scrutiny. The circumcision rate estimates come from MGMbill.org, an organization that advocates against circumcision. While the estimates broadly align with other published data, they are not from a government health agency or a peer-reviewed study. They should be read as approximations, not precise measurements.
The medical framing has also shifted over time. The American Academy of Pediatrics issued a 2012 policy statement concluding that the health benefits of newborn male circumcision outweigh the risks, citing reduced rates of urinary tract infections, certain sexually transmitted infections, and penile cancer. But the AAP stopped short of recommending the procedure for all newborns, leaving the decision to parents. That policy expired in 2018 and has not been renewed.
What the data does reveal clearly is that circumcision rates in the United States are shaped far more by geography, public insurance policy, and demographic composition than by individual medical consultations. A family's decision about circumcision is personal. But the odds of that decision going one way or the other are substantially determined by which side of a state line they happen to live on.
Sources & Notes
% of adult males that are circumcised.
the share of a state's total population that identifies as Hispanic or Latino, regardless of race.
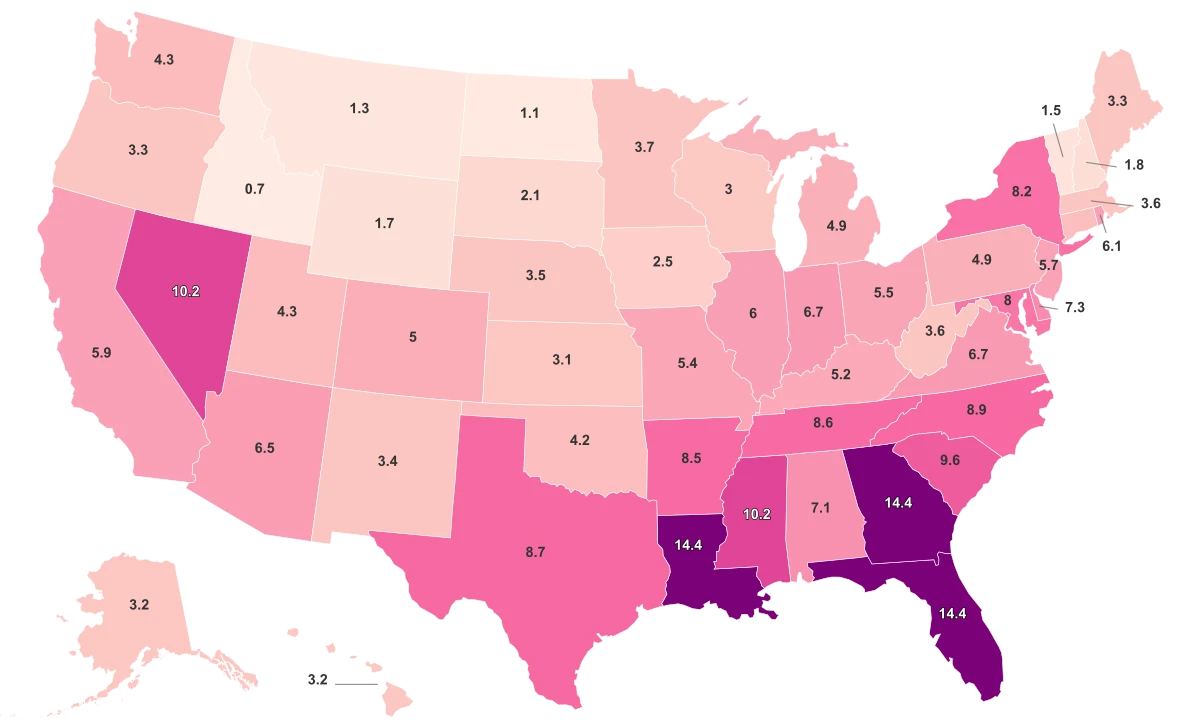
% of the total population that identifies as Asian or of Asian descent.