Air Quality By State

1▲13 | California | 55.5AQI+9.5 (+21%) | |
2▲14 | Arizona | 52.3AQI+6.9 (+15%) | |
3▼2 | Utah | 49.4AQI-1.8 (-3.5%) | |
4▲3 | Colorado | 47.1AQI | |
5▲26 | Nevada | 45AQI+2.9 (+6.9%) | |
6▲21 | Oklahoma | 43.6AQI+0.1 (+0.2%) | |
7▲19 | Illinois | 42.8AQI-0.8 (-1.8%) | |
7▲24 | New Mexico | 42.8AQI+0.7 (+1.7%) | |
9▲3 | Delaware | 42AQI-4.4 (-9.5%) | |
10▲35 | North Dakota | 41.9AQI+4.9 (+13%) | |
11▲6 | Connecticut | 41.4AQI-3.6 (-8.0%) | |
12▲5 | Wyoming | 41AQI-4 (-8.9%) | |
12▲3 | Pennsylvania | 41AQI-4.6 (-10%) | |
14▲25 | Wisconsin | 40.8AQI+1.3 (+3.3%) | |
15▲7 | New Jersey | 40.7AQI-3.4 (-7.7%) | |
15▲15 | Michigan | 40.7AQI-1.8 (-4.2%) | |
17▼9 | Maryland | 40.6AQI-6.4 (-14%) | |
18▲26 | Iowa | 40.5AQI+2.9 (+7.7%) | |
18▲19 | Montana | 40.5AQI+0.9 (+2.3%) | |
20▼18 | Ohio | 40.1AQI-8.1 (-17%) | |
21▼16 | Indiana | 39.7AQI-7.8 (-16%) | |
22▼9 | Kentucky | 39.6AQI-6.5 (-14%) | |
23▲5 | Arkansas | 39.3AQI-3.8 (-8.8%) | |
24▲10 | Texas | 38.9AQI-2.1 (-5.1%) | |
24▼1 | Missouri | 38.9AQI-5.1 (-12%) | |
24▲5 | Kansas | 38.9AQI-3.9 (-9.1%) | |
27▼25 | Georgia | 38.7AQI-9.5 (-20%) | |
28▲5 | Massachusetts | 38.6AQI-2.8 (-6.8%) | |
29▼5 | Mississippi | 38.2AQI-5.5 (-13%) | |
30▼10 | South Carolina | 38.1AQI-6.7 (-15%) | |
31▼21 | Alabama | 37.9AQI-8.7 (-19%) | |
32▼21 | North Carolina | 37.5AQI-9 (-19%) | |
33▲7 | Florida | 37.2AQI-1.7 (-4.4%) | |
34▼13 | Idaho | 37.1AQI-7.2 (-16%) | |
35— | New York | 37AQI-3.4 (-8.4%) | |
35▲2 | South Dakota | 37AQI-2.6 (-6.6%) | |
37▼32 | Tennessee | 36.8AQI-10.7 (-23%) | |
38▲5 | Minnesota | 36.6AQI-1.7 (-4.4%) | |
38▼3 | Louisiana | 36.6AQI-3.8 (-9.4%) | |
40— | New Hampshire | 36.4AQI-2.5 (-6.4%) | |
41▼37 | West Virginia | 36AQI-11.6 (-24%) | |
42▼18 | Rhode Island | 35.6AQI-8.1 (-19%) | |
43▼1 | Vermont | 34.9AQI-3.6 (-9.4%) | |
44▲3 | Maine | 34.5AQI-2 (-5.5%) | |
45▼28 | Virginia | 34.4AQI-10.6 (-24%) | |
46▲2 | Oregon | 34AQI-2.1 (-5.8%) | |
47▼2 | Nebraska | 31.9AQI-5.1 (-14%) | |
48▲1 | Washington | 29.9AQI-3.6 (-11%) | |
49▲1 | Alaska | 25.8AQI-3.3 (-11%) | |
50▲1 | Hawaii | 19.2AQI-2 (-9.4%) |
Last updated February 28, 2026
Snapshot of the U.S. Air Quality by State
Air quality plays a paramount role in overall environmental health, has a profound impact on human health, and can significantly influence the quality of life. Across the United States, air quality varies greatly from state to state, influenced by a multitude of factors including local climate, geography, population density, industrial practices, and traffic emissions. For citizens and policy makers alike, understanding comparative air quality from state to state is vital in order to develop effective environmental and health policies, raise public awareness, and inspire actions that contribute to cleaner air. Based on the Air Quality Index (AQI), the purpose of this article is to shed light on air quality by state and offers a comprehensive overview of the current status throughout the country. Key findings present notable trends and patterns:
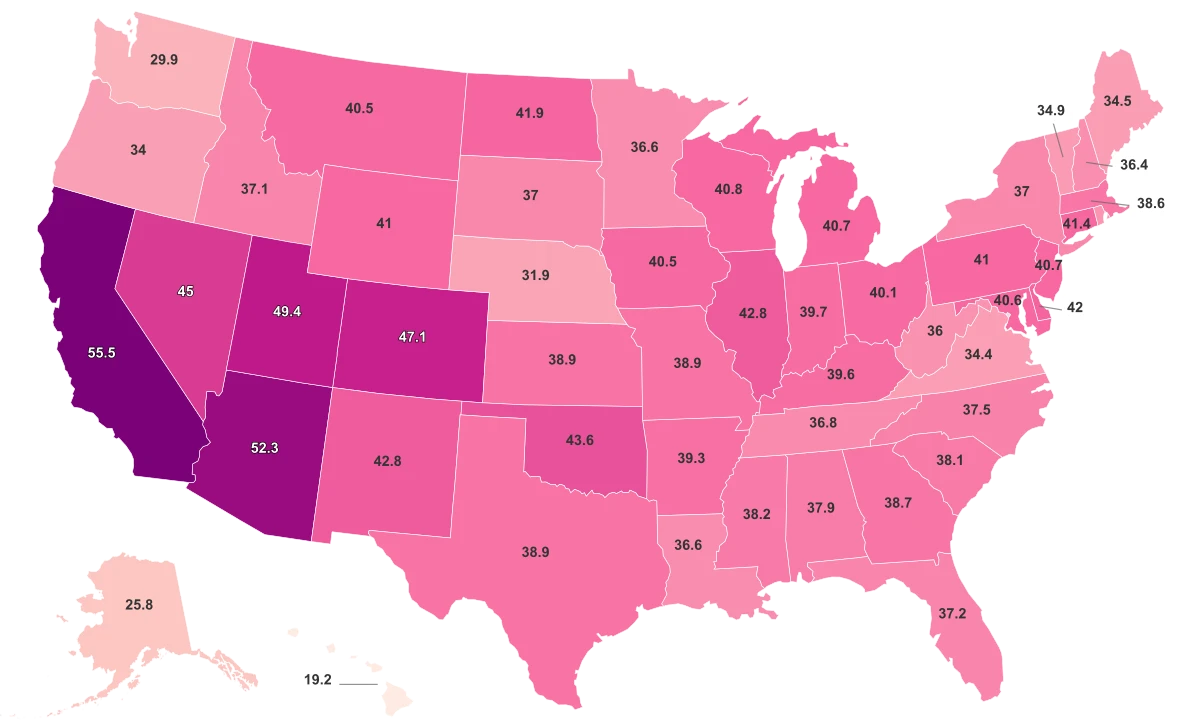
- The range in AQI across all states is quite expansive, with scores spanning from 19.2 to 55.5. This indicates a significant discrepancy in the air quality that communities are experiencing.
- The state with the cleanest air is Hawaii, with an AQI score of 19.2, while California trails at the other end of the spectrum with an AQI of 55.5, rendering it the state with the poorest air quality.
- Despite being geographically proximate, states differ remarkably in their air quality values. For example, Arizona scores an AQI of 52.3, while its neighbor, Nevada, scores significantly lower at 45.0.
- States known for their vast wilderness and lower industrial activity tend to have better air quality. Such states, Alaska (25.8) and Washington (29.9), are ranked within the top five for the best air quality.
- On the contrary, states with higher urbanization and industrial activities generally struggle with higher AQI scores. For instance, Illinois features an AQI of 42.8, which situates it amongst the top ten states with the most challenging air quality.
All Metrics
| Region ↕ | Air Quality Index 2019↕ | Environmental Health Impact Index 2023↕ | Average Radon Level↕ |
|---|---|---|---|
| California | |||
| Arizona | |||
| Utah | |||
| Colorado | |||
| Nevada | 45.0 | ||
| Oklahoma | |||
| Illinois | |||
| New Mexico | |||
| Delaware | 42.0 | ||
| North Dakota | |||
| Connecticut | |||
| Wyoming | 41.0 | ||
| Pennsylvania | 41.0 | ||
| Wisconsin | |||
| New Jersey | |||
| Michigan | |||
| Maryland | |||
| Iowa | |||
| Montana | |||
| Ohio | |||
| Indiana | |||
| Kentucky | |||
| Arkansas | |||
| Texas | |||
| Missouri | |||
| Kansas | |||
| Georgia | |||
| Massachusetts | |||
| Mississippi | |||
| South Carolina | |||
| Alabama | |||
| North Carolina | |||
| Florida | |||
| Idaho | |||
| New York | 37.0 | ||
| South Dakota | 37.0 | ||
| Tennessee | |||
| Minnesota | |||
| Louisiana | |||
| New Hampshire | |||
| West Virginia | 36.0 | ||
| Rhode Island | |||
| Vermont | |||
| Maine | |||
| Virginia | |||
| Oregon | 34.0 | ||
| Nebraska | |||
| Washington | |||
| Alaska | |||
| Hawaii |
States with Best Air Quality
Hawaii consistently proves itself as an oasis not only in terms of its paradisiacal qualities but also when it comes to the cleanness of its air. With an Air Quality Index of 19.2, it is certainly the breath of fresh air within our list. Hawaii's geographic isolation and strict environmental regulations contribute largely to this impressive feat. In second place, we find Alaska, with an AQI of 25.8. Its sprawling wilderness and scantily dispersed population make way for less pollutant emission, consequently maintaining cleaner air. Washington, coming in third at 29.9, benefits similarly from its vast landscapes and a keen focus on environmental preservation. Further down, with an AQI of 31.9, we have Nebraska. Nebraska's strong environmental policies coupled with less industrial activity relative to other states have bolstered its air quality. In fifth place, Oregon's clean and green reputation is solidified with an AQI of 34.0. This northwestern state benefits from large rural areas with smaller instances of industrial pollution. Rounding up the top ten, we have Virginia, Maine, Vermont, Rhode Island, and West Virginia reporting AQIs ranging from 34.4 to 36.0. These states manifest a certain equilibrium between urban development and environmental preservation, thus maintaining a better air quality profile. It should be noted that all these AQIs fall comfortably within the "good" category (0-50) of the AQI scale. Top ten states with the best air quality:
- Hawaii - 19.2
- Alaska - 25.8
- Washington - 29.9
- Nebraska - 31.9
- Oregon - 34.0
- Virginia - 34.4
- Maine - 34.5
- Vermont - 34.9
- Rhode Island - 35.6
- West Virginia - 36.0
States with the Worst Air Quality
Earning the unfortunate title of the state leading in air pollution is California. With an Air Quality Index score of 55.5, cities like Los Angeles, Visalia, Bakersfield, and Fresno are amongst those contributing to California's high score. Still, California is not alone in its struggle with poor air quality. Following closely is Arizona, with an AQI score of 52.3, largely due to vehicle emissions, industrial pollutants, and dust from the landscapes. Similarly, Utah, known for its picturesque mountains and valleys, ranks third with an AQI of 49.4 due to pollution sources such as vehicles, industrial plants, and wood burning. With an AQI of 47.1, Colorado comes next on the list. Nestled high among the Rocky Mountains, Denver suffers from high levels of ozone pollution due to various factors including steep topography, bright sun, and even the altitude itself. Nevada finds itself in the fifth rank with an AQI score of 45.0, affected both by local pollutant sources like mining and industrial operations, and interstate pollution from neighboring California. Other states contributing to the list of most polluted states are Oklahoma (43.6), Illinois and New Mexico, both with an AQI of 42.8, Delaware (42.0), and North Dakota (41.9). States with the Most Air Pollution:
- California - 55.5
- Arizona - 52.3
- Utah - 49.4
- Colorado - 47.1
- Nevada - 45.0
- Oklahoma - 43.6
- Illinois - 42.8
- New Mexico - 42.8
- Delaware - 42.0
- North Dakota - 41.9
Sources & Notes
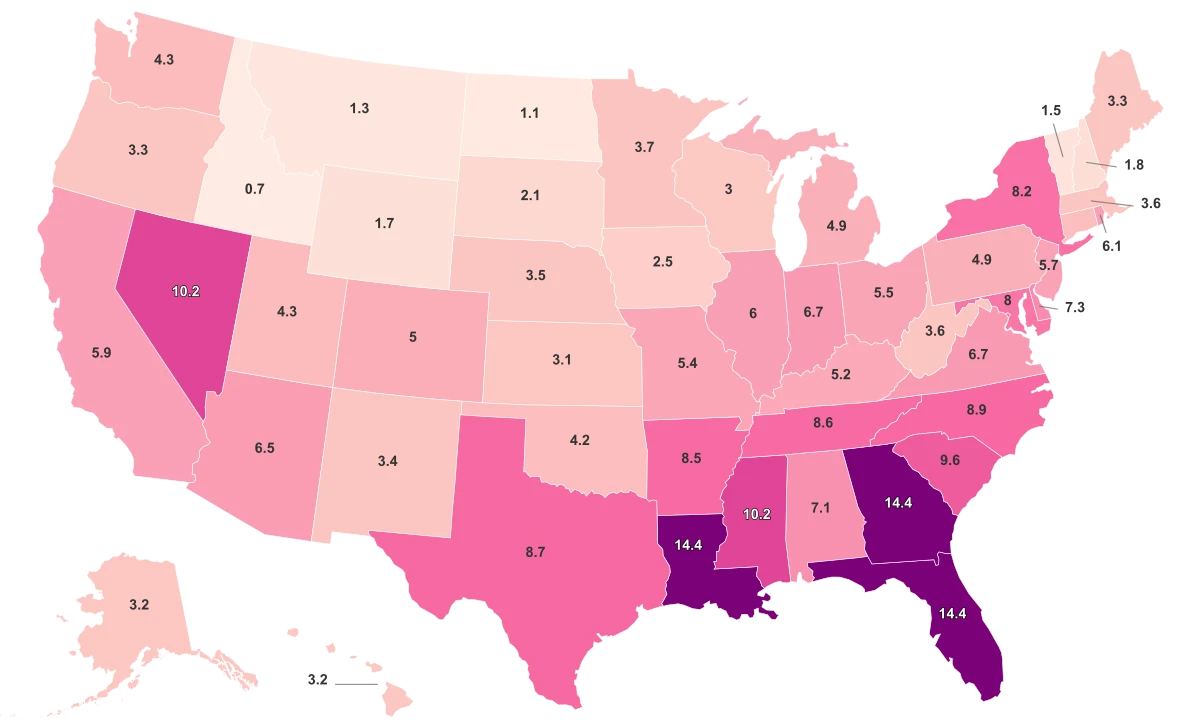
Numerical measure of air quality levels in a specific area.
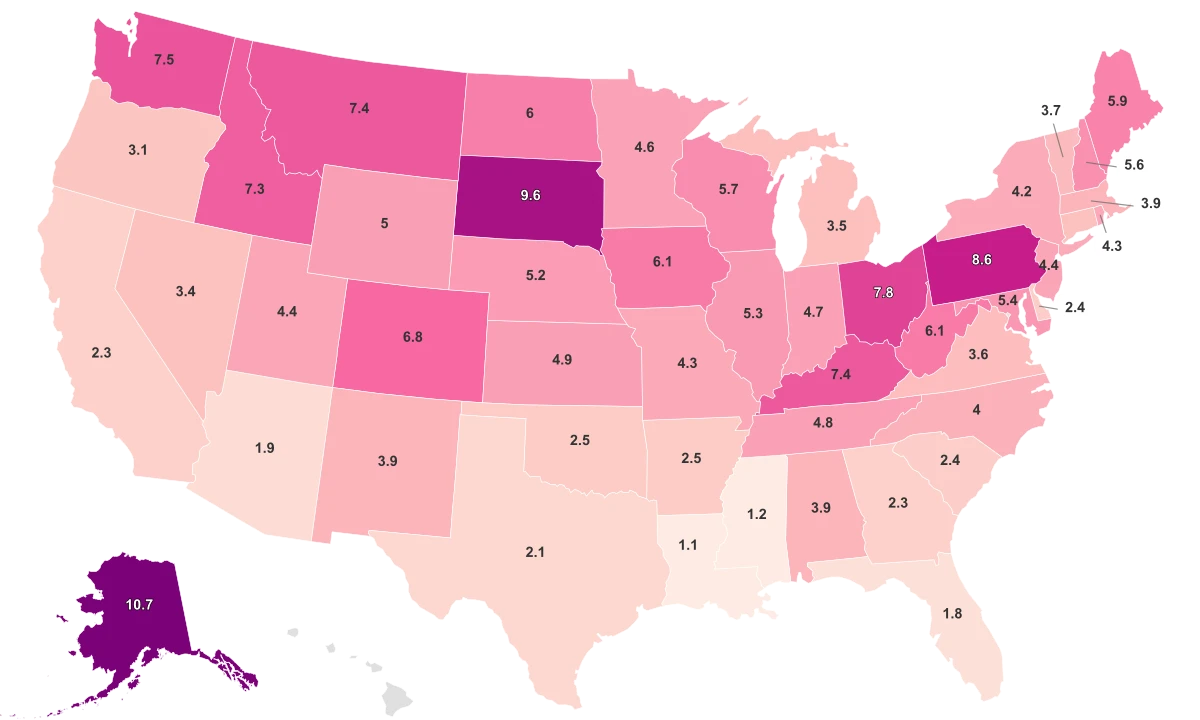
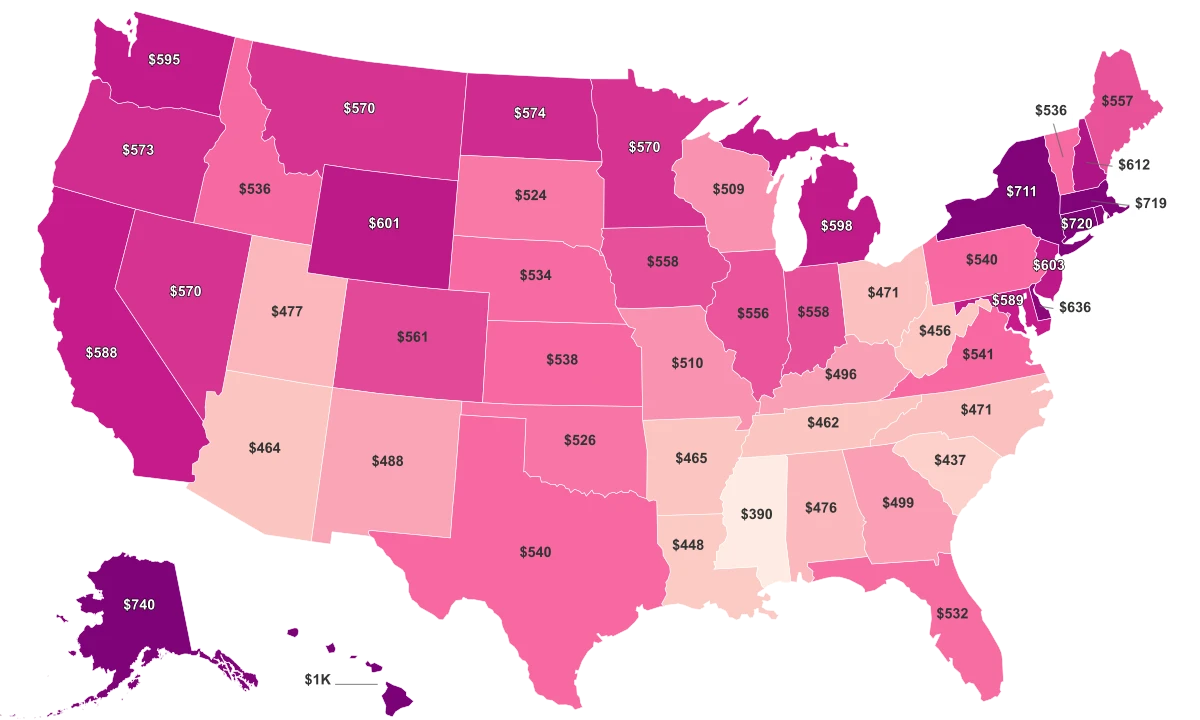
Mean concentration of naturally occurring radioactive radon gas.