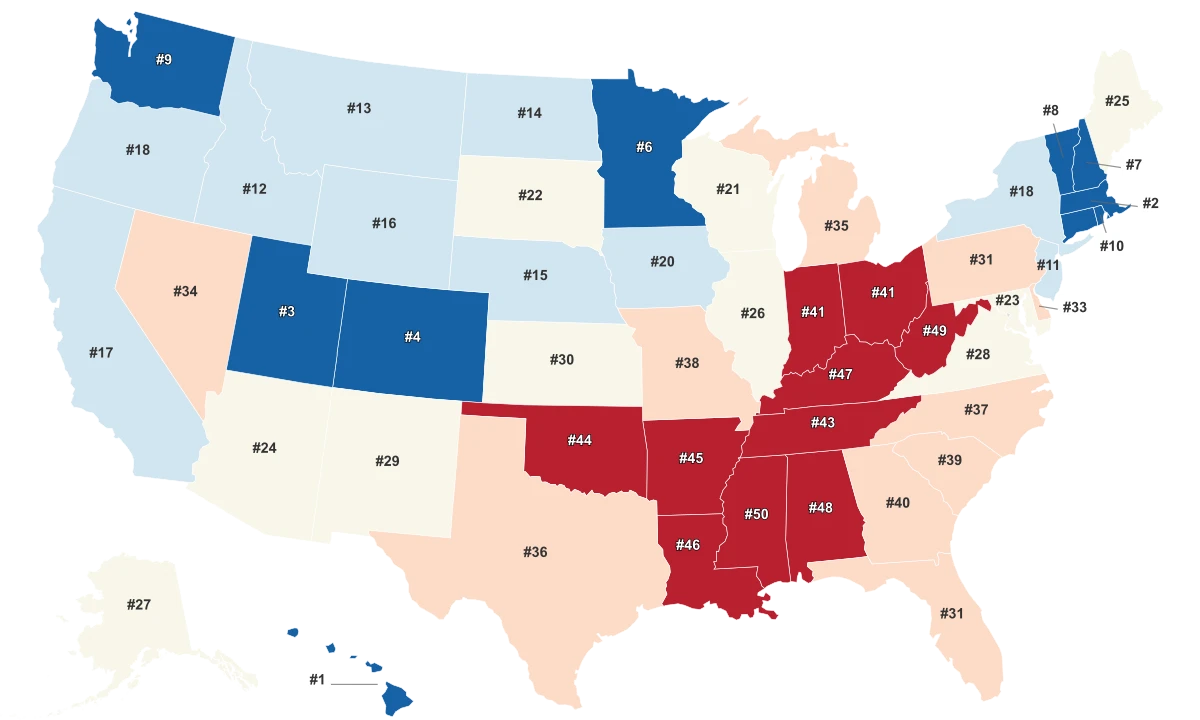
Life Expectancy By State

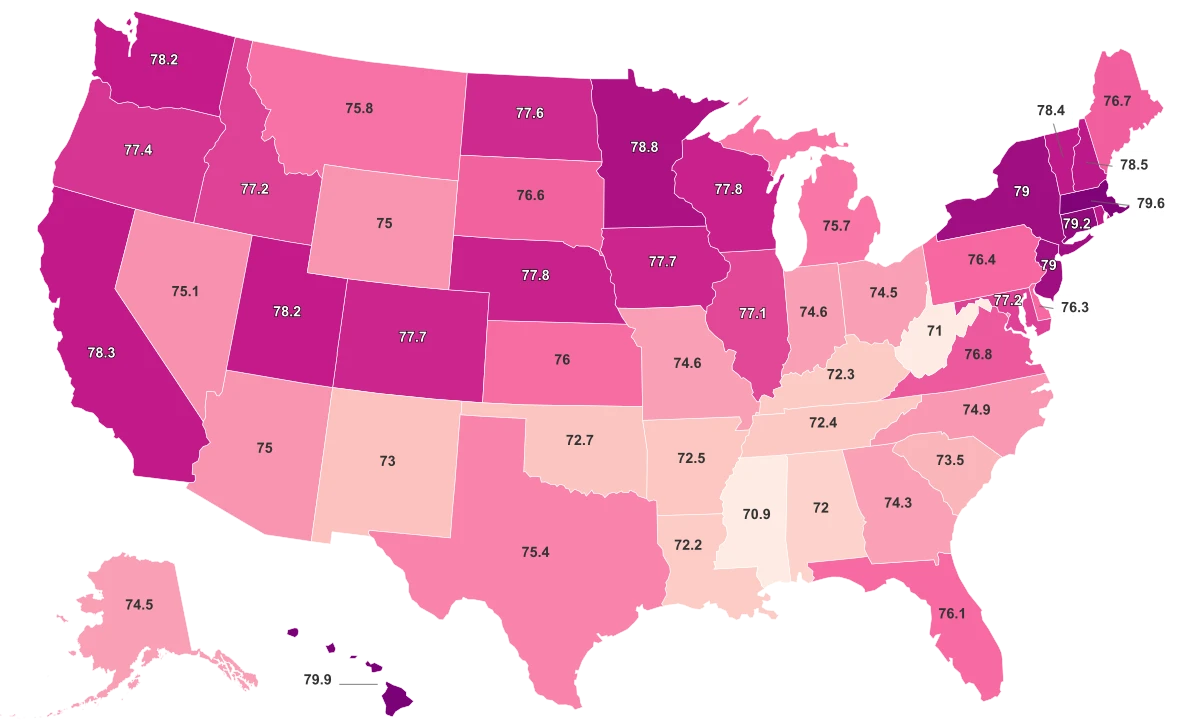
1 | Hawaii | 79.9years | |
2 | Massachusetts | 79.6years | |
3 | Connecticut | 79.2years | |
4 | New York | 79years | |
4 | New Jersey | 79years | |
6 | Minnesota | 78.8years | |
7 | Rhode Island | 78.5years | |
7 | New Hampshire | 78.5years | |
9 | Vermont | 78.4years | |
10 | California | 78.3years | |
11 | Washington | 78.2years | |
11 | Utah | 78.2years | |
13 | Nebraska | 77.8years | |
13 | Wisconsin | 77.8years | |
15 | Colorado | 77.7years | |
15 | Iowa | 77.7years | |
17 | North Dakota | 77.6years | |
18 | Oregon | 77.4years | |
19 | Maryland | 77.2years | |
19 | Idaho | 77.2years | |
21 | Illinois | 77.1years | |
22 | Virginia | 76.8years | |
23 | Maine | 76.7years | |
24 | South Dakota | 76.6years | |
25 | Pennsylvania | 76.4years | |
26 | Delaware | 76.3years | |
27 | Florida | 76.1years | |
28 | Kansas | 76years | |
29 | Montana | 75.8years | |
30 | Michigan | 75.7years | |
31 | Texas | 75.4years | |
32 | District of Columbia | 75.3years | |
33 | Nevada | 75.1years | |
34 | Wyoming | 75years | |
34 | Arizona | 75years | |
36 | North Carolina | 74.9years | |
37 | Missouri | 74.6years | |
37 | Indiana | 74.6years | |
39 | Alaska | 74.5years | |
39 | Ohio | 74.5years | |
41 | Georgia | 74.3years | |
42 | South Carolina | 73.5years | |
43 | New Mexico | 73years | |
44 | Oklahoma | 72.7years | |
45 | Arkansas | 72.5years | |
46 | Tennessee | 72.4years | |
47 | Kentucky | 72.3years | |
48 | Louisiana | 72.2years | |
49 | Alabama | 72years | |
50 | West Virginia | 71years | |
51 | Mississippi | 70.9years |
Last updated February 28, 2026
Longevity Across America
The range of life expectancy in the United States tells a compelling story—one where geography, healthcare, socio-economic status, lifestyle choices, and even genetics all dance hand in hand, shaping the degrees of longevity across the country. According to recent metrics, the average life expectancy in the United States ranges from 78.5 to 80.0 years, indicating nuances across various sources and states, and throwing a spotlight on the topic's multifaceted nature. Our data, shows a correlation between the quality of state healthcare systems, prevailing living conditions, and prevalent lifestyle choices. For instance, states with robust healthcare systems, lower crime rates, and healthier lifestyles, tend to report higher life expectancies.
- Hawaii, with a life expectancy of 80.7 years, leads the nation.
- Mississippi, unfortunately, records the lowest life expectancy at 71.9 years—a whole nine years less than Hawaii.
- States with life expectancy higher than the national average are primarily located in the Western and North Eastern U.S.
- Southern states fall towards the lower end of the scale, indicating regional differences that possibly stem from lifestyle, socio-economic status, and quality of healthcare.
All Metrics
| Region ↕ | Life Expectancy 2021↕ | Overall Health Index 2023↕ | Healthcare Quality Index 2023↕ | Poverty Rate 2023↕ |
|---|---|---|---|---|
| Hawaii | ||||
| Massachusetts | ||||
| Connecticut | ||||
| New York | 79.0 | |||
| New Jersey | 79.0 | |||
| Minnesota | ||||
| Rhode Island | ||||
| New Hampshire | ||||
| Vermont | ||||
| California | ||||
| Washington | ||||
| Utah | ||||
| Nebraska | ||||
| Wisconsin | ||||
| Colorado | ||||
| Iowa | ||||
| North Dakota | ||||
| Oregon | ||||
| Maryland | ||||
| Idaho | ||||
| Illinois | ||||
| Virginia | ||||
| Maine | ||||
| South Dakota | ||||
| Pennsylvania | ||||
| Delaware | ||||
| Florida | ||||
| Kansas | 76.0 | |||
| Montana | ||||
| Michigan | ||||
| Texas | ||||
| District of Columbia | ||||
| Nevada | ||||
| Wyoming | 75.0 | |||
| Arizona | 75.0 | |||
| North Carolina | ||||
| Missouri | ||||
| Indiana | ||||
| Alaska | ||||
| Ohio | ||||
| Georgia | ||||
| South Carolina | ||||
| New Mexico | 73.0 | |||
| Oklahoma | ||||
| Arkansas | ||||
| Tennessee | ||||
| Kentucky | ||||
| Louisiana | ||||
| Alabama | 72.0 | |||
| West Virginia | 71.0 | |||
| Mississippi |
States with the Longest Lives
Hawaii leads the nation with a life expectancy of 80.7 years. Reasons for Hawaii's high standing include a robust healthcare system, lower crime rates, and an emphasis on balanced, active lifestyles. Coming in second is the state of Washington, with a life expectancy of 79.2 years. Washington's high ranking is owed to its quality healthcare services, high standard of living, and the state's focus on wellness. Minnesota closely follows with a life expectancy of 79.1 years. Factors contributing to the state's third-place standing include quality healthcare and emphasis on the active, outdoor living which is part of the state’s culture. Named fourth and fifth are the states of New Hampshire and Massachusetts, each boasting a life expectancy of 79 years. High standards of living, healthcare services, and overall state wealth contribute to these high life expectancy figures. California, known for its emphasis on healthy living, ties with New Hampshire and Massachusetts with a life expectancy of 79 years. Vermont and Oregon jointly occupy the seventh place, with residents typically reaching 78.8 years. Factors contributing to the high life expectancy include access to quality healthcare and an emphasis on healthy living. Utah and Idaho round off the top ten, coming in at ninth and tenth respectively. In Utah, residents can expect to live 78.6 years, while in Idaho, the life expectancy is a slightly lower 78.4 years. States with the Longest Lives:
- Hawaii - 80.7
- Washington - 79.2
- Minnesota - 79.1
- New Hampshire - 79
- Massachusetts - 79
- California - 79
- Vermont - 78.8
- Oregon - 78.8
- Utah - 78.6
- Idaho - 78.4
States with the Shortest Lives
Topping the list with the lowest life expectancy is Mississippi, coming in at 71.9 years. While there could be various contributing factors, prior studies have linked Mississippi's low life expectancy rate with the state's high rates of obesity, poverty, and disparity in access to quality healthcare. West Virginia follows slightly behind, with an average life expectancy of 72.8 years. The state has consistently struggled with health issues, including opioid misuse and related deaths, which have likely impacted life expectancy rates. Louisiana, with its life expectancy at 73.1 years, and Alabama, at 73.2 years, are two other southern states that fall well below the national average. Once again, socio-economic factors, healthcare accessibility, and lifestyle choices could contribute to their lower positions. Rounding out the bottom five in life expectancy is Kentucky, where life expectancy averages 73.5 years. Similar to the aforementioned states, issues like obesity, smoking, and drug abuse may play significant roles in this lower rate. Other states with lower life expectancies include Arkansas and Tennessee (both at 73.8 years), Oklahoma (74.1 years), New Mexico (74.5 years), and South Carolina (74.8 years). States with the Shortest Lives:
- Mississippi - 71.9 years
- West Virginia - 72.8 years
- Louisiana - 73.1 years
- Alabama - 73.2 years
- Kentucky - 73.5 years
- Arkansas - 73.8 years
- Tennessee - 73.8 years
- Oklahoma - 74.1 years
- New Mexico - 74.5 years
- South Carolina - 74.8 years
Sources & Notes
Average number of years a newborn is expected to live.
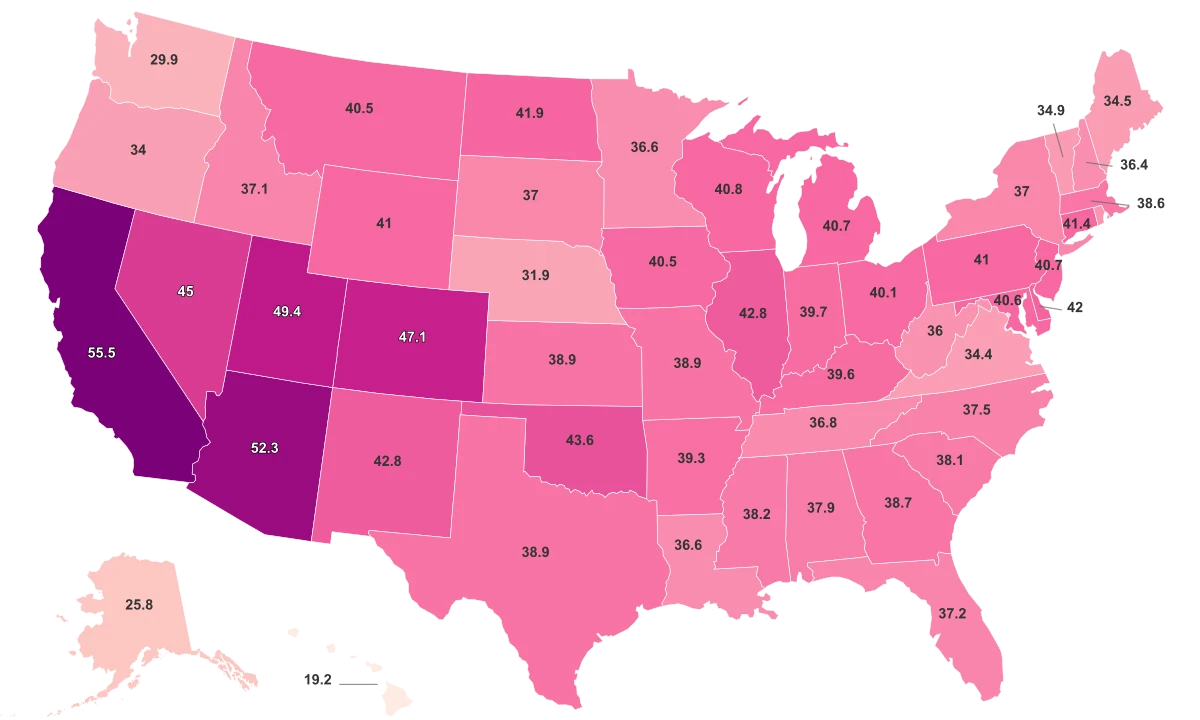
% of the population living below the national poverty line.