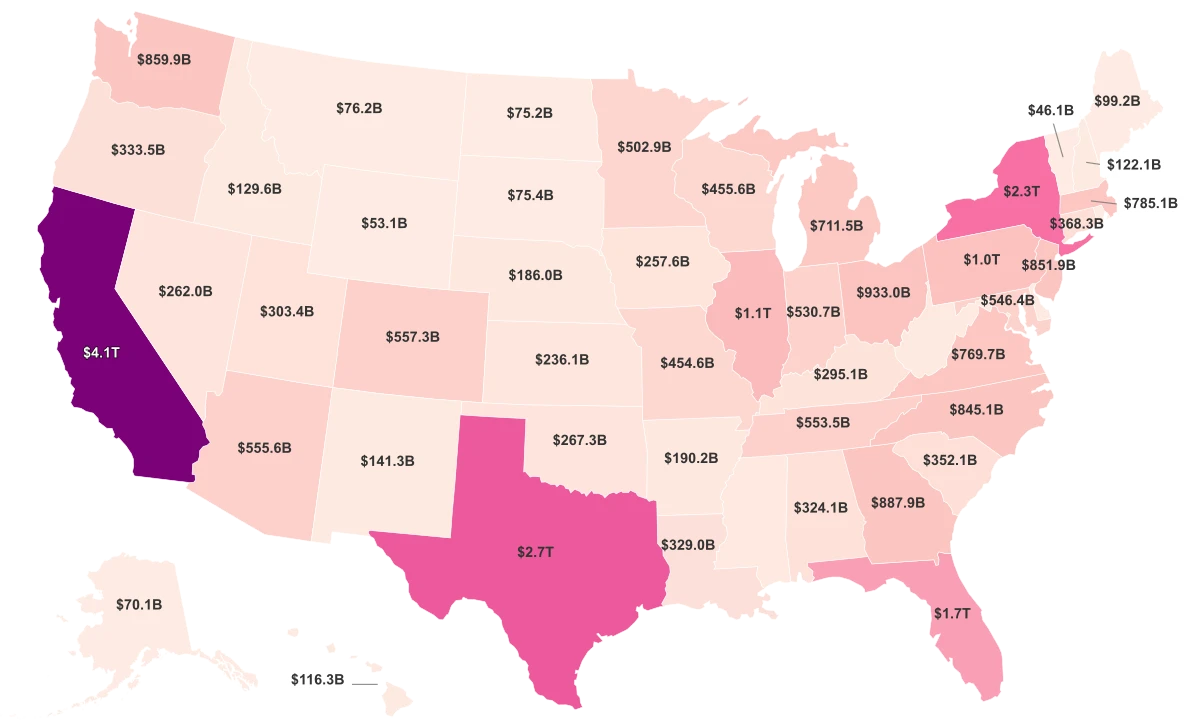
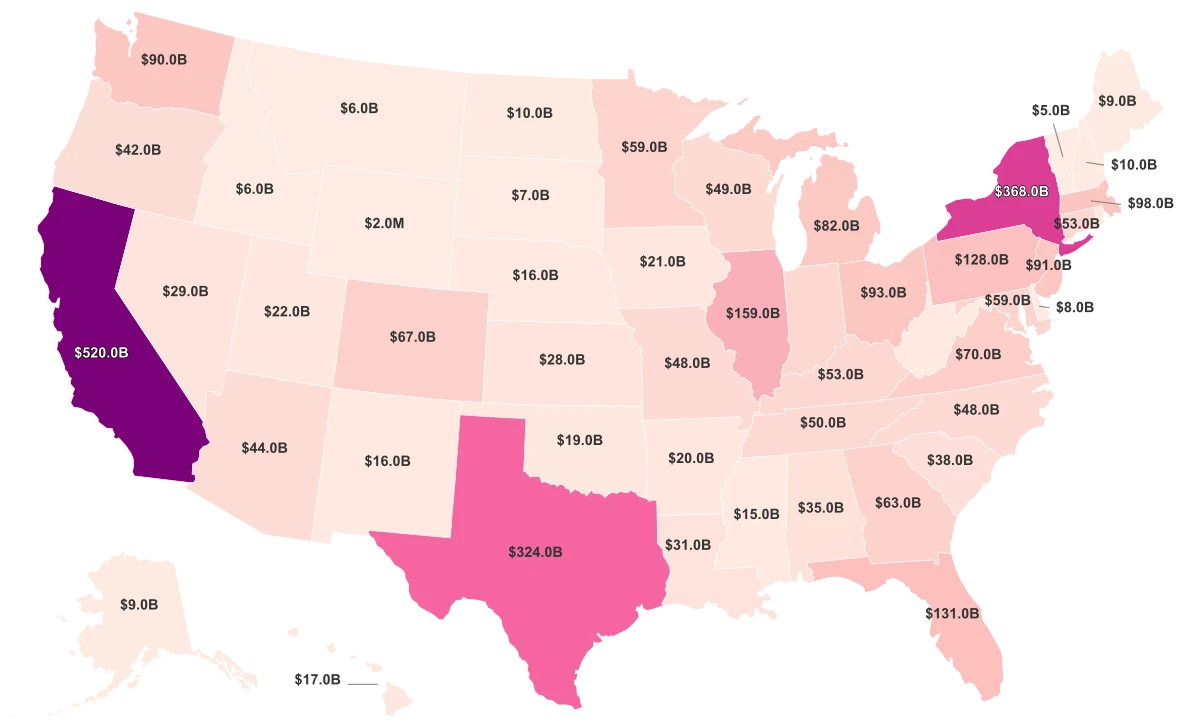
Richest States In USA

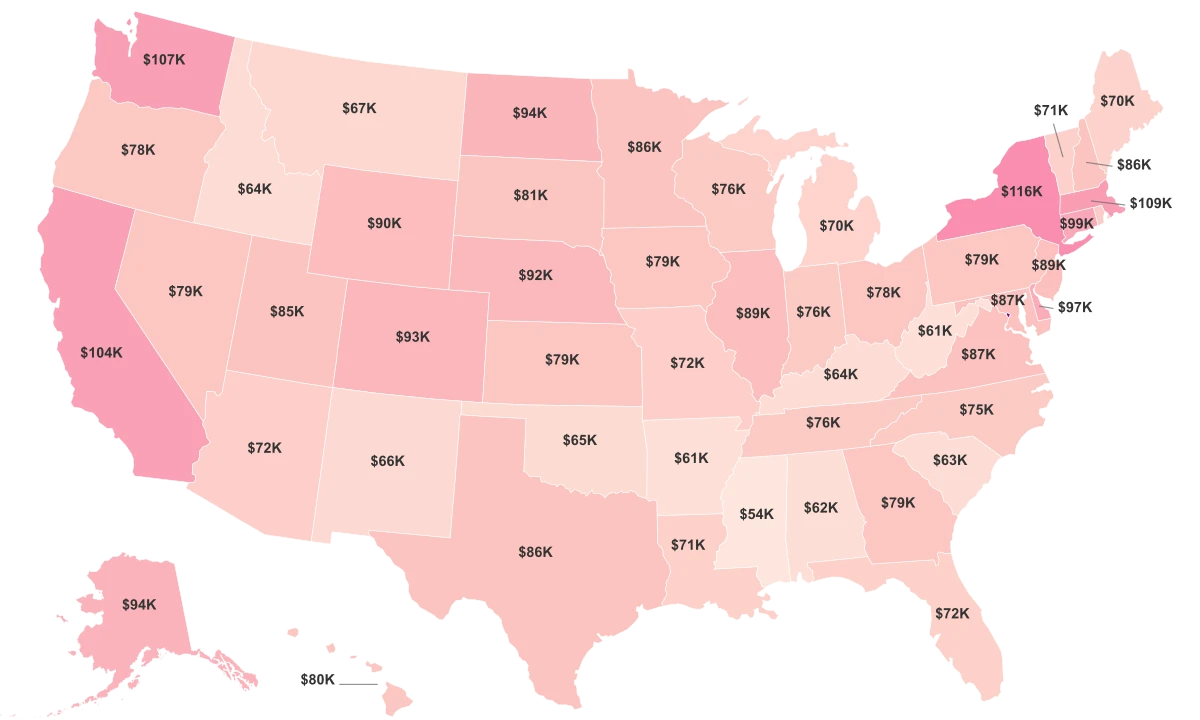
1 |  | District of Columbia | $261,234.34 |
2 |  | New York | $115,565.16 |
3 |  | Massachusetts | $108,960.04 |
4 |  | Washington | $106,698.44 |
5 |  | California | $104,181.17 |
6 |  | Connecticut | $99,355.02 |
7 |  | Delaware | $97,428.35 |
8 |  | Alaska | $94,306.47 |
9 |  | North Dakota | $93,548.1 |
10 |  | Colorado | $92,673.83 |
11 |  | Nebraska | $91,923.17 |
12 |  | Wyoming | $90,065.73 |
13 |  | Illinois | $89,456.26 |
14 |  | New Jersey | $88,532.29 |
15 |  | Virginia | $86,598.33 |
16 |  | Maryland | $86,595.2 |
17 |  | New Hampshire | $86,227.45 |
18 |  | Minnesota | $86,220.55 |
19 |  | Texas | $85,609.94 |
20 |  | Utah | $85,119.81 |
21 |  | South Dakota | $81,020.76 |
22 |  | Hawaii | $80,151.63 |
23 |  | Kansas | $78,978.56 |
24 |  | Nevada | $78,912.96 |
25 |  | Iowa | $78,900.37 |
26 |  | Georgia | $78,596.12 |
27 |  | Pennsylvania | $78,560.56 |
28 |  | Ohio | $78,127.38 |
29 |  | Oregon | $77,711.49 |
30 |  | Indiana | $76,152.27 |
31 |  | Wisconsin | $76,039.05 |
32 |  | Tennessee | $75,743.24 |
33 |  | North Carolina | $75,385.83 |
34 |  | Rhode Island | $74,142.65 |
35 |  | Missouri | $72,352.05 |
36 |  | Arizona | $72,235.15 |
37 |  | Florida | $72,059.56 |
38 |  | Louisiana | $71,398.25 |
39 |  | Vermont | $71,140.78 |
40 |  | Maine | $70,362.6 |
41 |  | Michigan | $69,769.46 |
42 |  | Montana | $66,652.96 |
43 |  | New Mexico | $66,049.03 |
44 |  | Oklahoma | $64,775.26 |
45 |  | Kentucky | $63,798.19 |
46 |  | Idaho | $63,797.41 |
47 |  | South Carolina | $63,206.24 |
48 |  | Alabama | $62,350.03 |
49 |  | West Virginia | $61,242.41 |
50 |  | Arkansas | $61,221.53 |
51 |  | Mississippi | $53,874.38 |
Last updated June 25, 2026
Key Takeaways
- The District of Columbia leads on economic output per resident at about $261,200, in a class entirely its own.
- Mississippi sits at the bottom at roughly $53,900, the only state below the $55,000 mark.
- The distance from top to floor is more than $207,000 per person, and even the median state, near $78,600, is far closer to Mississippi than to the capital.
- The leaders are small high-output economies and coastal hubs, not the largest states; California, the biggest state economy overall, ranks only fifth.
All Metrics
| Region ↕ | GDP Per Capita 2024↕ | Median Household Income 2023↕ | Income per Capita 2024↕ | Poverty Rate 2023↕ |
|---|---|---|---|---|
| District of Columbia | $261.2K | |||
| New York | $115.6K | |||
| Massachusetts | $109K | |||
| Washington | $106.7K | |||
| California | $104.2K | |||
| Connecticut | $99.4K | |||
| Delaware | $97.4K | |||
| Alaska | $94.3K | |||
| North Dakota | $93.5K | |||
| Colorado | $92.7K | |||
| Nebraska | $91.9K | |||
| Wyoming | $90.1K | |||
| Illinois | $89.5K | |||
| New Jersey | $88.5K | |||
| Virginia | $86.6K | |||
| Maryland | $86.6K | |||
| New Hampshire | $86.2K | |||
| Minnesota | $86.2K | |||
| Texas | $85.6K | |||
| Utah | $85.1K | |||
| South Dakota | $81K | |||
| Hawaii | $80.2K | |||
| Kansas | $79K | |||
| Nevada | $78.9K | |||
| Iowa | $78.9K | |||
| Georgia | $78.6K | |||
| Pennsylvania | $78.6K | |||
| Ohio | $78.1K | |||
| Oregon | $77.7K | |||
| Indiana | $76.2K | |||
| Wisconsin | $76K | |||
| Tennessee | $75.7K | |||
| North Carolina | $75.4K | |||
| Rhode Island | $74.1K | |||
| Missouri | $72.4K | |||
| Arizona | $72.2K | |||
| Florida | $72.1K | |||
| Louisiana | $71.4K | |||
| Vermont | $71.1K | |||
| Maine | $70.4K | |||
| Michigan | $69.8K | |||
| Montana | $66.7K | |||
| New Mexico | $66K | |||
| Oklahoma | $64.8K | |||
| Kentucky | $63.8K | |||
| Idaho | $63.8K | |||
| South Carolina | $63.2K | |||
| Alabama | $62.4K | |||
| West Virginia | $61.2K | |||
| Arkansas | $61.2K | |||
| Mississippi | $53.9K |
What 'Richest' Means When You Measure Output Per Person
This ranking sorts states by how much economic value they produce for each resident, and the answer at the extremes is stark: the District of Columbia tops the table at about $261,200 per person, while Mississippi anchors the bottom at roughly $53,900. The figures come from the U.S. Bureau of Economic Analysis, which measures each state's gross domestic product for 2024 and divides it by population to get a per-capita number.
A higher figure means a state's economy generates more output for every person who lives there, which is a measure of production rather than the cash that lands in any household's bank account. It also is not adjusted for the cost of living, so a big per-person output does not automatically buy more in one place than another. Most states cluster between roughly $64,000 and $95,000, with a long reach upward to a single figure that sits far above everyone else.
| Rank | State | GDP per capita (2024) |
|---|---|---|
| 1 | District of Columbia | $261,200 |
| 2 | New York | $115,600 |
| 3 | Massachusetts | $109,000 |
| 4 | Washington | $106,700 |
| 5 | California | $104,200 |
| 6 | Connecticut | $99,400 |
| 7 | Delaware | $97,400 |
| 8 | Alaska | $94,300 |
| ... | ... | ... |
| 49 | West Virginia | $61,200 |
| 50 | Arkansas | $61,200 |
| 51 | Mississippi | $53,900 |
The District That Breaks the Chart
The first thing to know about the top of this list is that the leader is not a state. The District of Columbia is a federal district, and its output per resident is more than triple that of the typical state, a distance no actual state comes close to closing. Strip it out and the real race among states begins with New York at about $115,600.
The reason is structural rather than a sign that residents there are three times richer. The federal government was the single largest contributor to DC's economy in 2024 at $44.7 billion, followed by professional and business services at $38.6 billion. That is an enormous amount of high-value work packed into a small resident population, and many of the people doing it commute in from Maryland and Virginia rather than living inside the district. The output counts where it is produced; the workers are counted somewhere else.
Output Per Person Is Not the Paycheck
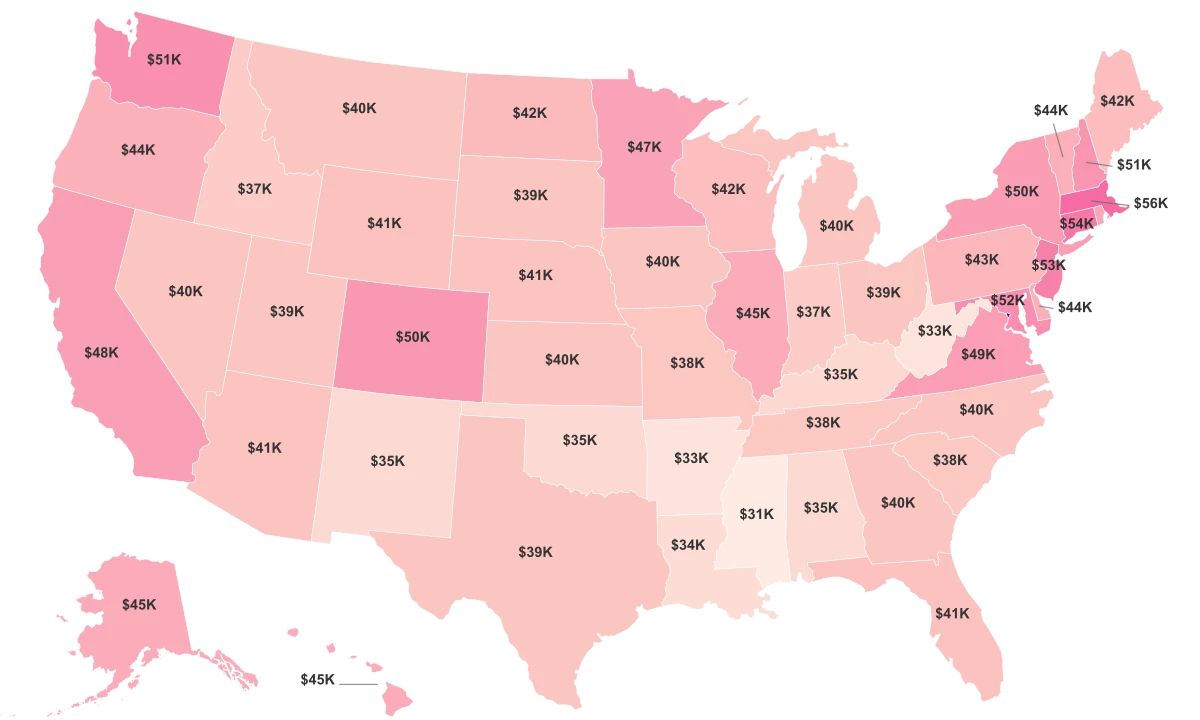
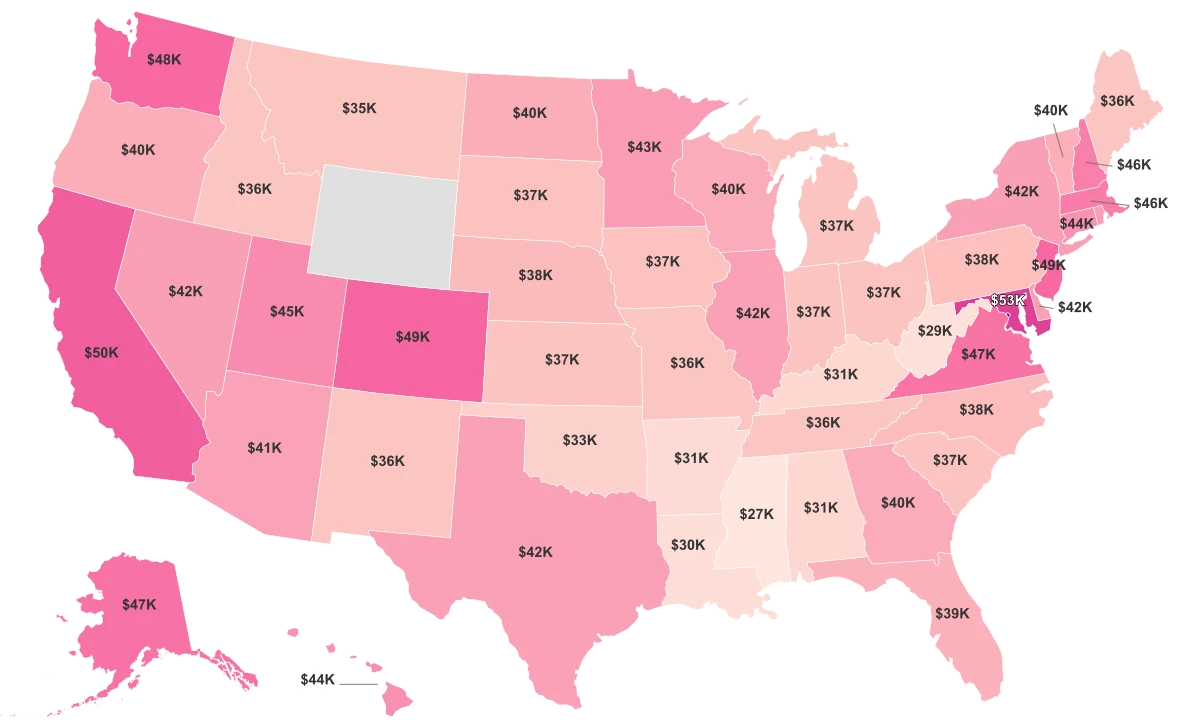
The most common way to misread this table is to treat a high output number as a high paycheck, and the two are genuinely different things. Economic output per resident comes from national accounts and folds in business investment, government spending, and activity that never reaches a household, while what families actually earn is measured separately through household surveys. States that produce more per person do tend to report higher incomes as well, but the link is loose enough that the ranking of one is not the ranking of the other.
This is also why the "richest" states by output are not the country's biggest economies. California has the largest state economy in absolute dollars, yet on output per resident it places fifth, behind New York, Massachusetts, and Washington. Size and density pull in different directions here: a state can produce a vast total and still land mid-pack once that total is spread across tens of millions of people.
Coastal Hubs, a Long Middle, and a Mississippi Floor
Below the capital, the map sorts into three rough zones. A cluster of coastal and specialized economies leads the states, from New York and Massachusetts to finance-heavy Delaware and resource-rich, thinly populated Alaska and North Dakota. Then comes a long middle where most states sit within a fairly narrow band, before the floor drops to Mississippi at about $53,900, the only state under $55,000 and trailed closely by Arkansas and West Virginia near $61,200.
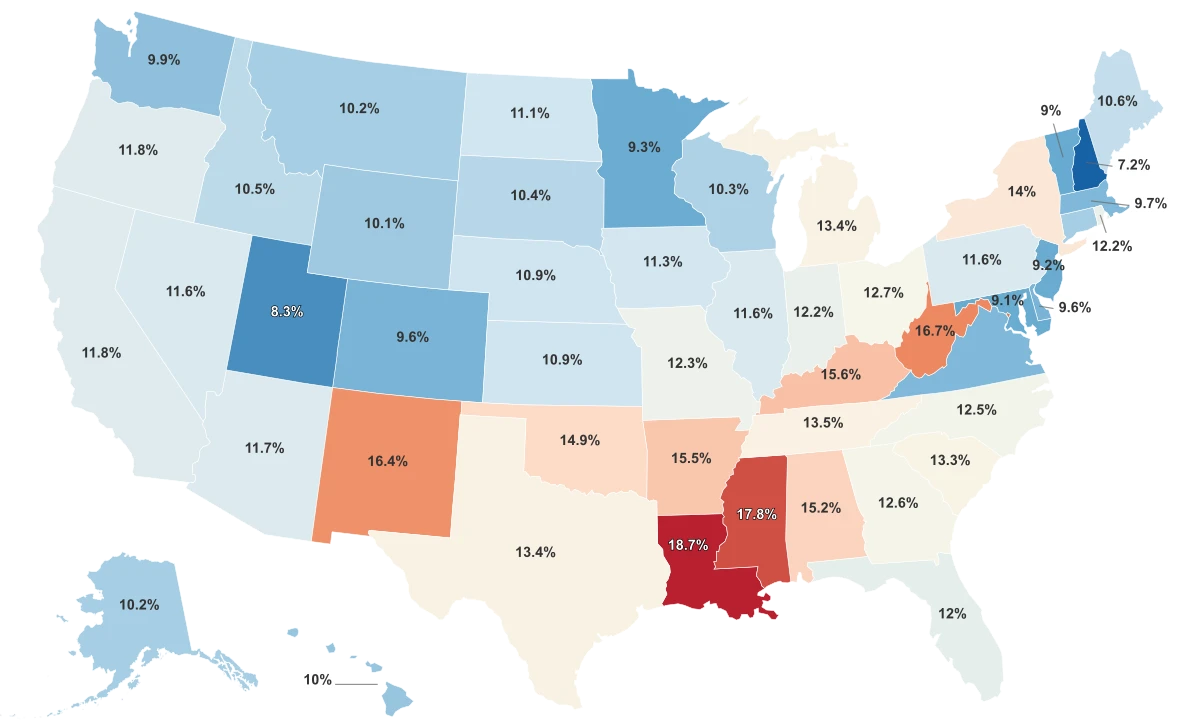
The lowest-output states share a structural story. Several cluster in the South and Appalachia, where economies lean more on lower-wage industries like agriculture and meatpacking than on the high-value finance and technology that lift the leaders. The same states tend to carry the heaviest poverty as well: Mississippi, Louisiana, and West Virginia all report poverty rates above 16 percent, the high end of the national range.
Zoom out to the four Census regions and the divide is real but modest. The Northeast produces the most per resident on average, near $88,100, and the Midwest the least, around $81,000, a spread of only a few thousand dollars. That regional gap is a fraction of the distance between individual states, which is the clearer signal: where a state ranks owes far more to the particular industries clustered inside it than to the part of the country it sits in.
Sources & Notes
Total value of goods and services produced divided by population.
Middle household income value, with half of households earning more and half earning less.
Average total earnings and wages received per person annually.
% of the population living below the national poverty line.