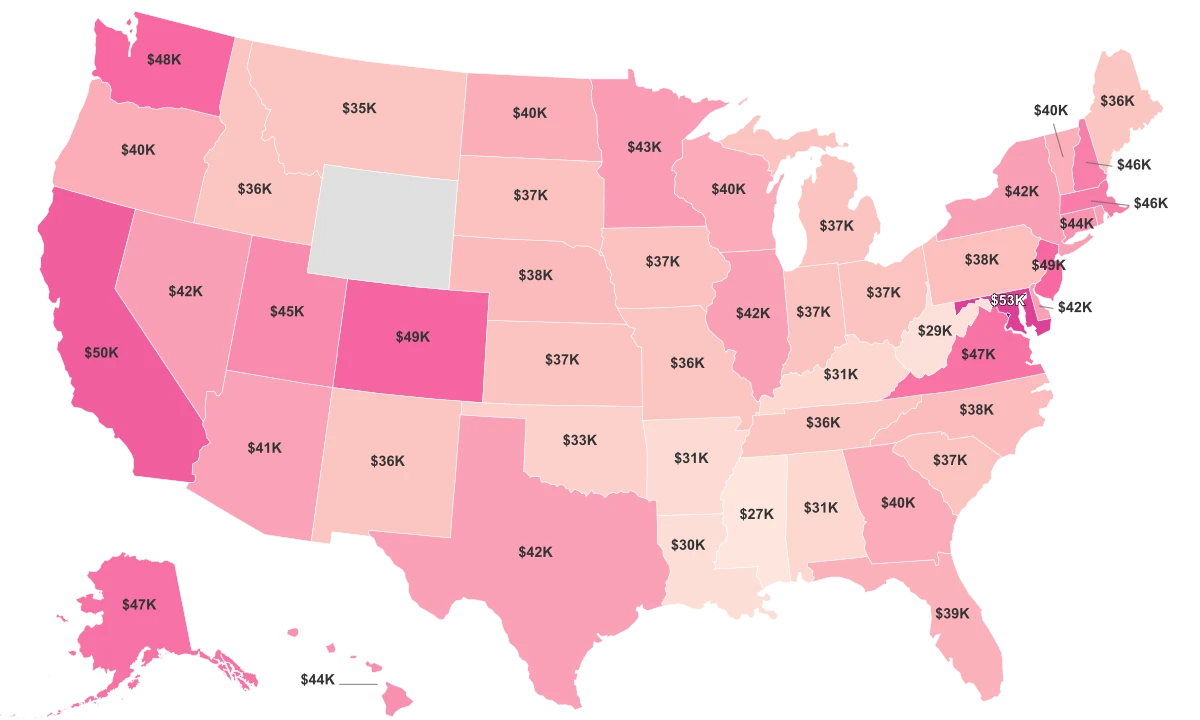
Median Household Income By State

1 | District of Columbia | $75,814 | |
2 | Maryland | $52,519 | |
3 | California | $50,251 | |
4 | Colorado | $49,447 | |
5 | New Jersey | $48,523 | |
6 | Washington | $48,386 | |
7 | Alaska | $46,819 | |
8 | Virginia | $46,767 | |
9 | Massachusetts | $45,920 | |
10 | New Hampshire | $45,746 | |
11 | Utah | $44,905 | |
12 | Hawaii | $44,402 | |
13 | Connecticut | $44,224 | |
14 | Minnesota | $43,172 | |
15 | New York | $42,397 | |
16 | Rhode Island | $42,225 | |
17 | Delaware | $42,168 | |
18 | Nevada | $42,034 | |
19 | Illinois | $41,888 | |
20 | Texas | $41,661 | |
21 | Arizona | $41,272 | |
22 | Georgia | $40,028 | |
23 | Wisconsin | $39,966 | |
24 | Oregon | $39,791 | |
25 | North Dakota | $39,690 | |
26 | Vermont | $39,613 | |
27 | Florida | $39,438 | |
28 | Nebraska | $38,276 | |
29 | North Carolina | $38,073 | |
30 | Pennsylvania | $37,725 | |
31 | South Dakota | $37,260 | |
32 | Iowa | $37,172 | |
33 | Michigan | $36,687 | |
34 | Indiana | $36,674 | |
35 | Ohio | $36,615 | |
36 | South Carolina | $36,564 | |
37 | Kansas | $36,534 | |
38 | Missouri | $36,283 | |
39 | Tennessee | $36,264 | |
40 | Maine | $36,001 | |
41 | New Mexico | $35,969 | |
42 | Idaho | $35,951 | |
43 | Montana | $35,369 | |
44 | Oklahoma | $32,704 | |
45 | Kentucky | $31,481 | |
46 | Alabama | $31,232 | |
47 | Arkansas | $30,682 | |
48 | Louisiana | $29,921 | |
49 | West Virginia | $29,140 | |
50 | Mississippi | $27,205 |
Last updated February 28, 2026
Introduction
Income disparity in the United States is a topic of significant societal interest and concern, representing a complex tangle of geographical, educational, and economic factors. The median household income serves as an invaluable barometer in these discussions. Each year, the U.S. Census Bureau compiles a comprehensive report on income and poverty, offering us a momentous insight into the nuanced income patterns across the country.
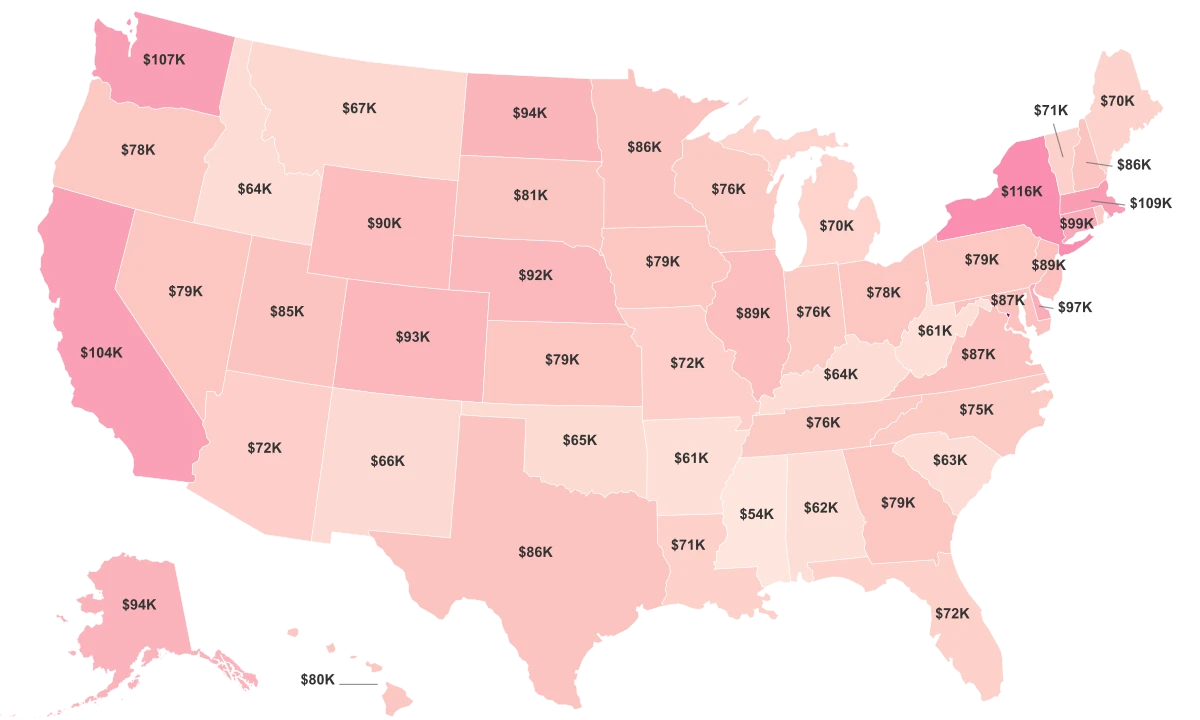
- Maryland topped the list for the highest median household income, at $87,063, followed closely by New Jersey and Massachusetts. The South Eastern state of Mississippi reported the lowest median income, at $46,511, illustrating a significant income disparity across states.
- The median household income appeared to be higher on the country's coasts, both in Northeast and West Coast states like Maryland, New Jersey, Massachusetts, and California, pointing to potential influences of local economies, education levels, and industries.
- Many states experienced income levels above the national median income of $67,521, such as Hawaii and Connecticut, confirming the geographical pattern of higher incomes in coastal regions.
- Conversely, states in the Midwest, Appalachia, and the South tended to see lower incomes, with West Virginia, Arkansas, and Louisiana reporting median incomes considerably below the national average.
All Metrics
| Region ↕ | Median Household Income 2023↕ | Income per Capita 2024↕ | Cost of Living Index 2024↕ | Poverty Rate 2023↕ |
|---|---|---|---|---|
| District of Columbia | $75.8K | |||
| Maryland | $52.5K | |||
| California | $50.3K | |||
| Colorado | $49.4K | |||
| New Jersey | $48.5K | |||
| Washington | $48.4K | |||
| Alaska | $46.8K | |||
| Virginia | $46.8K | |||
| Massachusetts | $45.9K | |||
| New Hampshire | $45.7K | |||
| Utah | $44.9K | |||
| Hawaii | $44.4K | |||
| Connecticut | $44.2K | |||
| Minnesota | $43.2K | |||
| New York | $42.4K | |||
| Rhode Island | $42.2K | |||
| Delaware | $42.2K | |||
| Nevada | $42K | |||
| Illinois | $41.9K | |||
| Texas | $41.7K | |||
| Arizona | $41.3K | |||
| Georgia | $40K | |||
| Wisconsin | $40K | |||
| Oregon | $39.8K | |||
| North Dakota | $39.7K | |||
| Vermont | $39.6K | |||
| Florida | $39.4K | |||
| Nebraska | $38.3K | |||
| North Carolina | $38.1K | |||
| Pennsylvania | $37.7K | |||
| South Dakota | $37.3K | |||
| Iowa | $37.2K | |||
| Michigan | $36.7K | |||
| Indiana | $36.7K | |||
| Ohio | $36.6K | |||
| South Carolina | $36.6K | |||
| Kansas | $36.5K | |||
| Missouri | $36.3K | |||
| Tennessee | $36.3K | |||
| Maine | $36K | |||
| New Mexico | $36K | |||
| Idaho | $36K | |||
| Montana | $35.4K | |||
| Oklahoma | $32.7K | |||
| Kentucky | $31.5K | |||
| Alabama | $31.2K | |||
| Arkansas | $30.7K | |||
| Louisiana | $29.9K | |||
| West Virginia | $29.1K | |||
| Mississippi | $27.2K |
States with the Highest Household Income
Maryland boasts the highest median household income, standing at an impressive $87,063 per year. Interestingly, the areas close to Washington, D.C., such as Howard and Montgomery counties, flourish with high-income jobs in sectors like government, defense, and tech, indicating the influence of robust local economies on income levels. Neighboring Northeastern states, New Jersey and Massachusetts, closely follow Maryland holding the second and third spots, respectively, with their median household incomes of $85,245 and $84,385. Here, the lucrative sectors include finance, cutting-edge technology, biotechnology, and higher education, pointing towards a definite correlation between industrial strength and median incomes. A winding path leads us to the Pacific, where Hawaii and California find their place in the fourth and sixth spots, respectively. Their pristine coastlines house median household incomes of $83,173 and $78,672 per annum. Meanwhile, Connecticut in the East rests at the fifth position, flaunting an income of $79,855. Further down the list, we encounter New Hampshire, Alaska, Washington, and Virginia, with median household incomes ranging from $76,398 to $77,923. States with the highest household incomes:
- Maryland - $87,063
- New Jersey - $85,245
- Massachusetts - $84,385
- Hawaii - $83,173
- Connecticut - $79,855
- California - $78,672
- New Hampshire - $77,923
- Alaska - $77,790
- Washington - $77,006
- Virginia - $76,398
States with the Lowest Household Income
Mississippi records the lowest median household income of $46,511. West Virginia follows in 49th place, with a median income of $48,037, reflecting the economic difficulties that the Appalachian region confronts. Arkansas' median income sits at $49,475, securing a rank of the 48th among the states. Louisiana, one of America's most culturally rich states, registers a disappointingly low median income - ranked 47th with a median income of $50,800. States like New Mexico ($51,243), Alabama ($52,035), Kentucky ($52,238), Oklahoma ($53,840), Tennessee ($54,833), and South Carolina ($54,864) although marginally better off, unfortunately, also fall under the category of states with the lowest median household income. States with the Lowest Household Income:
- Mississippi - $46,511
- West Virginia - $48,037
- Arkansas - $49,475
- Louisiana - $50,800
- New Mexico - $51,243
- Alabama - $52,035
- Kentucky - $52,238
- Oklahoma - $53,840
- Tennessee - $54,833
- South Carolina - $54,864
Sources & Notes
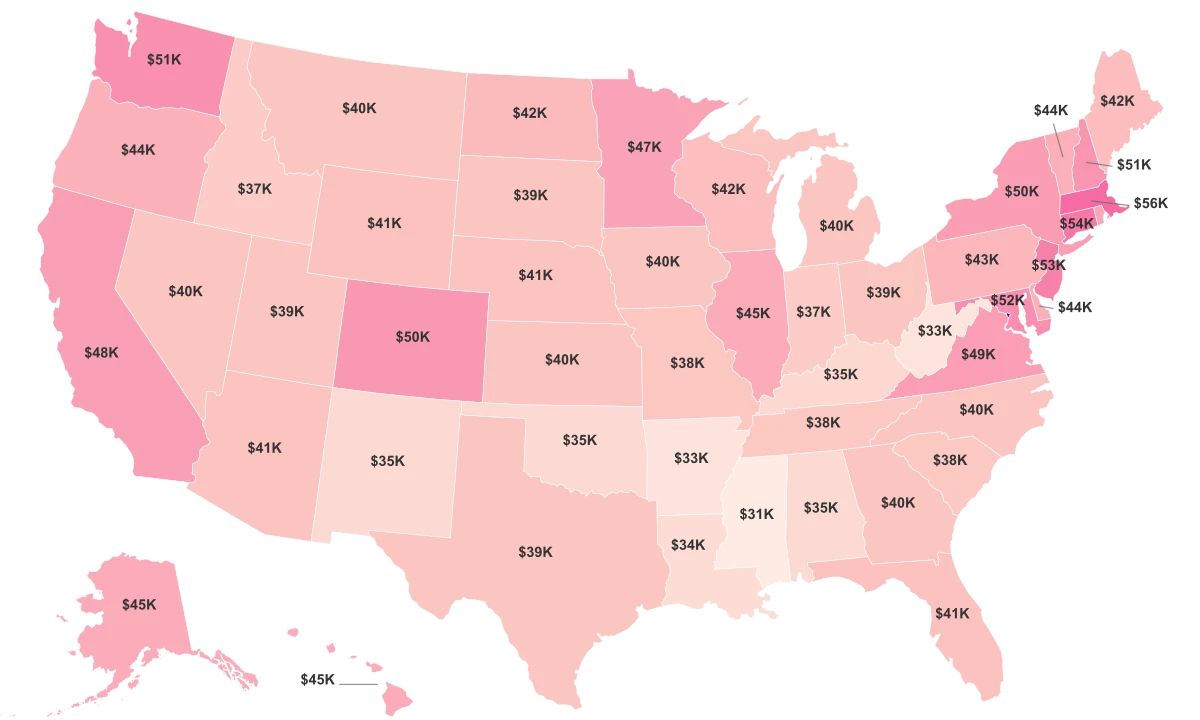
Middle household income value, with half of households earning more and half earning less.
Average total earnings and wages received per person annually.
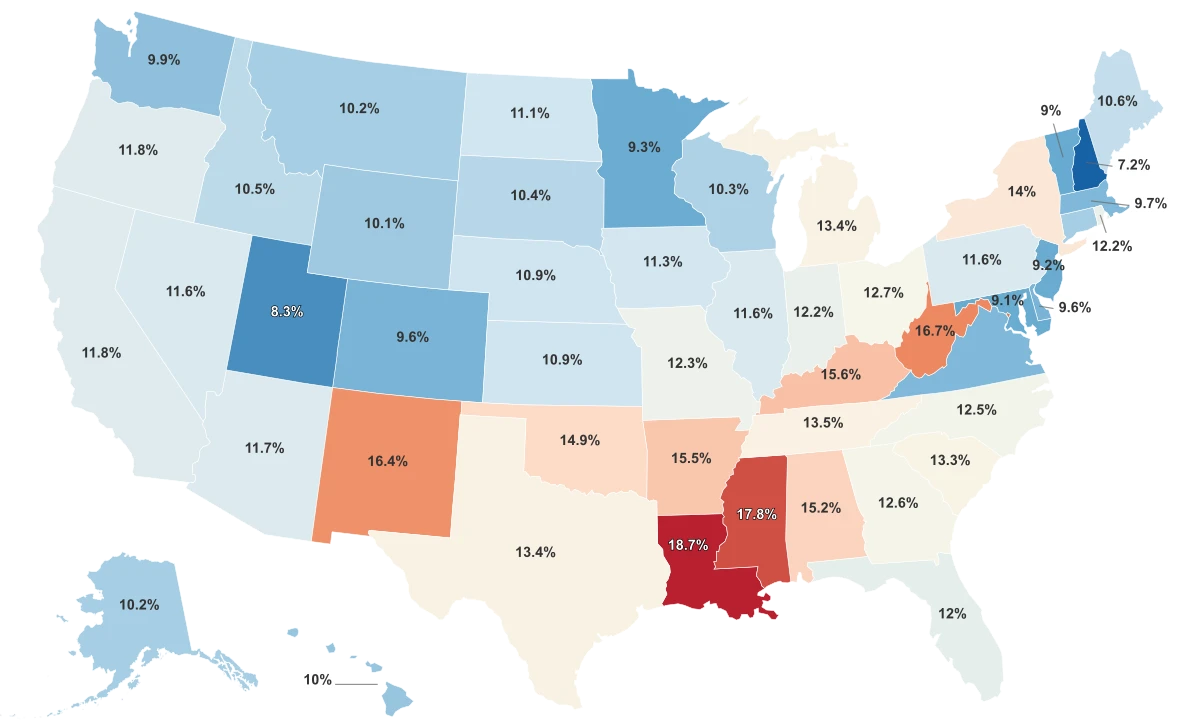
% of the population living below the national poverty line.