Poorest States

1— | Louisiana | 18.7%-0.9 (-4.6%) | |
2— | Mississippi | 17.8%-1.6 (-8.2%) | |
3▲2 | District of Columbia | 17.3%+0.8 (+4.8%) | |
4— | West Virginia | 16.7%-0.1 (-0.6%) | |
5▼2 | New Mexico | 16.4%-2 (-11%) | |
6▼1 | Kentucky | 15.6%-0.9 (-5.5%) | |
7— | Arkansas | 15.5%-0.8 (-4.9%) | |
8— | Alabama | 15.2%-0.9 (-5.6%) | |
9— | Oklahoma | 14.9%-0.7 (-4.5%) | |
10▲4 | New York | 14%+0.1 (+0.7%) | |
11▲4 | Tennessee | 13.5%-0.1 (-0.7%) | |
12▼1 | Texas | 13.4%-0.8 (-5.6%) | |
12▲6 | Michigan | 13.4%+0.3 (+2.3%) | |
14▼4 | South Carolina | 13.3%-1.3 (-8.9%) | |
15▲1 | Ohio | 12.7%-0.7 (-5.2%) | |
16▼3 | Georgia | 12.6%-1.4 (-10%) | |
17▼1 | North Carolina | 12.5%-0.9 (-6.7%) | |
18▲3 | Missouri | 12.3%-0.4 (-3.1%) | |
19▲5 | Indiana | 12.2% | |
19▲13 | Rhode Island | 12.2%+0.8 (+7.0%) | |
21▼3 | Florida | 12%-1.1 (-8.4%) | |
22▲2 | Oregon | 11.8%-0.4 (-3.3%) | |
22— | California | 11.8%-0.5 (-4.1%) | |
24▼4 | Arizona | 11.7%-1.1 (-8.6%) | |
25▼13 | Nevada | 11.6%-2.5 (-18%) | |
25▲1 | Pennsylvania | 11.6%-0.5 (-4.1%) | |
25▲1 | Illinois | 11.6%-0.5 (-4.1%) | |
28▲7 | Iowa | 11.3%+0.2 (+1.8%) | |
29▲6 | North Dakota | 11.1% | |
30▲8 | Nebraska | 10.9%+0.1 (+0.9%) | |
30▼1 | Kansas | 10.9%-0.8 (-6.8%) | |
32▼1 | Maine | 10.6%-0.9 (-7.8%) | |
33▲4 | Idaho | 10.5%-0.5 (-4.5%) | |
34▼12 | South Dakota | 10.4%-1.9 (-15%) | |
35▲3 | Wisconsin | 10.3%-0.5 (-4.6%) | |
36▲4 | Alaska | 10.2%-0.3 (-2.9%) | |
36▼8 | Montana | 10.2%-1.7 (-14%) | |
36▲10 | Connecticut | 10.2%+0.1 (+1.0%) | |
39▼7 | Wyoming | 10.1%-1.3 (-11%) | |
40▼6 | Hawaii | 10%-1.2 (-11%) | |
41▲6 | Washington | 9.9% | |
42▲2 | Virginia | 9.7%-0.5 (-4.9%) | |
42▼1 | Massachusetts | 9.7%-0.7 (-6.7%) | |
44▼14 | Delaware | 9.6%-2 (-17%) | |
44▲4 | Colorado | 9.6%-0.1 (-1.0%) | |
46▲3 | Minnesota | 9.3% | |
47▼3 | New Jersey | 9.2%-1 (-9.8%) | |
48▼6 | Maryland | 9.1%-1.2 (-12%) | |
49▼7 | Vermont | 9%-1.3 (-13%) | |
50— | Utah | 8.3%-0.3 (-3.5%) | |
51— | New Hampshire | 7.2% |
Last updated February 28, 2026
The Poorest States in America
Within the borders of the remarkably wealthy United States, the specter of poverty looms large, manifesting as an inability to meet basic needs such as food, clothing, and shelter for many individuals and families. While the U.S. government sets annual poverty thresholds, these overlook regional differences in the cost of living, creating a significant gap in understanding the lived experience of poverty, varying widely from state to state. Based on the current guidelines, an individual earning $13,590 a year or less or a family of four earning $27,750 or less is considered to be living in poverty, putting even some full-time minimum-wage workers below the poverty line.
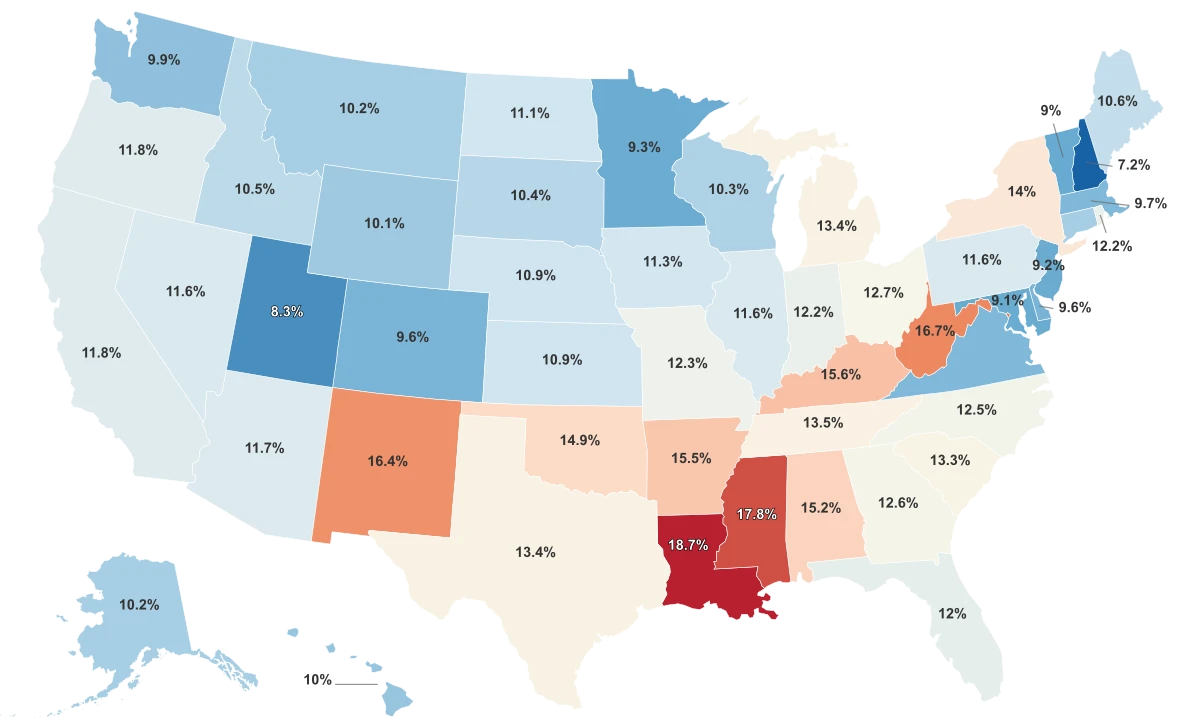
- Southern states struggle the most, with the highest poverty rates observed in Mississippi (19.3%), Louisiana (18.6%), and New Mexico (18.1%). This can be attributed to many factors such as lower median incomes, higher unemployment rates, and lower levels of educational attainment.
- Conversely, poverty rates in the Northeast are significantly lower, with New Hampshire boasting the lowest poverty rate at just 6.9%. This is possibly linked with higher median incomes, educational attainment, and access to social services.
- A surprising finding is the high poverty rate in states that are traditionally considered economically prosperous. Both California (12.5%) and New York (13.2%) feature in the top half of this list, testifying to large wealth disparities within these states.
- A downward pattern is discernible as one moves from South to North, with the northern states having comparatively lower poverty rates.
- The states with the lowest poverty rates tend to be those with diversified economies and a strong emphasis on education and healthcare, such as Massachusetts (9.4%), Maryland (8.6%), and Utah (8.3%).
All Metrics
| Region ↕ | Poverty Rate 2023↕ | Median Household Income 2023↕ | Income per Capita 2024↕ | Snap Recipients 2025↕ |
|---|---|---|---|---|
| Louisiana | 18.7% | |||
| Mississippi | 17.8% | |||
| District of Columbia | 17.3% | |||
| West Virginia | 16.7% | |||
| New Mexico | 16.4% | |||
| Kentucky | 15.6% | |||
| Arkansas | 15.5% | |||
| Alabama | 15.2% | |||
| Oklahoma | 14.9% | |||
| New York | 14.0% | |||
| Tennessee | 13.5% | |||
| Texas | 13.4% | |||
| Michigan | 13.4% | |||
| South Carolina | 13.3% | |||
| Ohio | 12.7% | |||
| Georgia | 12.6% | |||
| North Carolina | 12.5% | |||
| Missouri | 12.3% | |||
| Indiana | 12.2% | |||
| Rhode Island | 12.2% | |||
| Florida | 12.0% | |||
| Oregon | 11.8% | |||
| California | 11.8% | |||
| Arizona | 11.7% | |||
| Nevada | 11.6% | |||
| Pennsylvania | 11.6% | |||
| Illinois | 11.6% | |||
| Iowa | 11.3% | |||
| North Dakota | 11.1% | |||
| Nebraska | 10.9% | |||
| Kansas | 10.9% | |||
| Maine | 10.6% | |||
| Idaho | 10.5% | |||
| South Dakota | 10.4% | |||
| Wisconsin | 10.3% | |||
| Alaska | 10.2% | |||
| Montana | 10.2% | |||
| Connecticut | 10.2% | |||
| Wyoming | 10.1% | |||
| Hawaii | 10.0% | |||
| Washington | 9.9% | |||
| Virginia | 9.7% | |||
| Massachusetts | 9.7% | |||
| Delaware | 9.6% | |||
| Colorado | 9.6% | |||
| Minnesota | 9.3% | |||
| New Jersey | 9.2% | |||
| Maryland | 9.1% | |||
| Vermont | 9.0% | |||
| Utah | 8.3% | |||
| New Hampshire | 7.2% |
10 Poorest States
Mississippi, topping the list with a poverty rate of 19.3%, is the poorest state in the nation. Despite numerous efforts to improve the economy, Mississippi struggles with a combination of factors such as high unemployment rates, lower education levels, and inherited poverty. Second on the list is Louisiana, with a poverty rate of 18.6%. Issues contributing to this high rate may include limited access to quality education and healthcare, and a dearth of stable, well-paying jobs. New Mexico, with a poverty rate of 18.1%, ranks third among the poorest states in America. Despite its rich cultural heritage and potential for growth, New Mexico grapples with disparities in its socio-economic status. West Virginia holds the fourth place with a poverty rate of 17.0%. Despite an abundance of natural resources, the state struggles with high unemployment due to the decline of the coal industry. Kentucky experiences a poverty rate of 15.9%, placing it fifth in the rankings. The state faces challenges due to a transitioning economy and a lack of diversification in its industries. Arkansas is marked with a poverty rate of 15.3%. The state has a large rural population where ongoing lack of access to educational and financial resources contribute to persisting poverty. Seventh on the list is Alabama with a 15.0% poverty rate. The state experiences high levels of inherited poverty and struggles with lack of access to quality education. Oklahoma has a poverty rate of 14.5%. Oklahoma's poverty story is linked to job instability, lower wages, and disparities in access to social services across the state. Tennessee and South Carolina are tied, with a poverty rate of 13.5%. These states are impacted by a combination of factors like unemployment, lack of education, and inadequate access to essential services. Ten poorest states (by poverty rate):
- Mississippi - 19.3%
- Louisiana - 18.6%
- New Mexico - 18.1%
- West Virginia - 17.0%
- Kentucky - 15.9%
- Arkansas - 15.3%
- Alabama - 15.0%
- Oklahoma - 14.5%
- Tennessee - 13.5%
- South Carolina - 13.5%
Sources & Notes
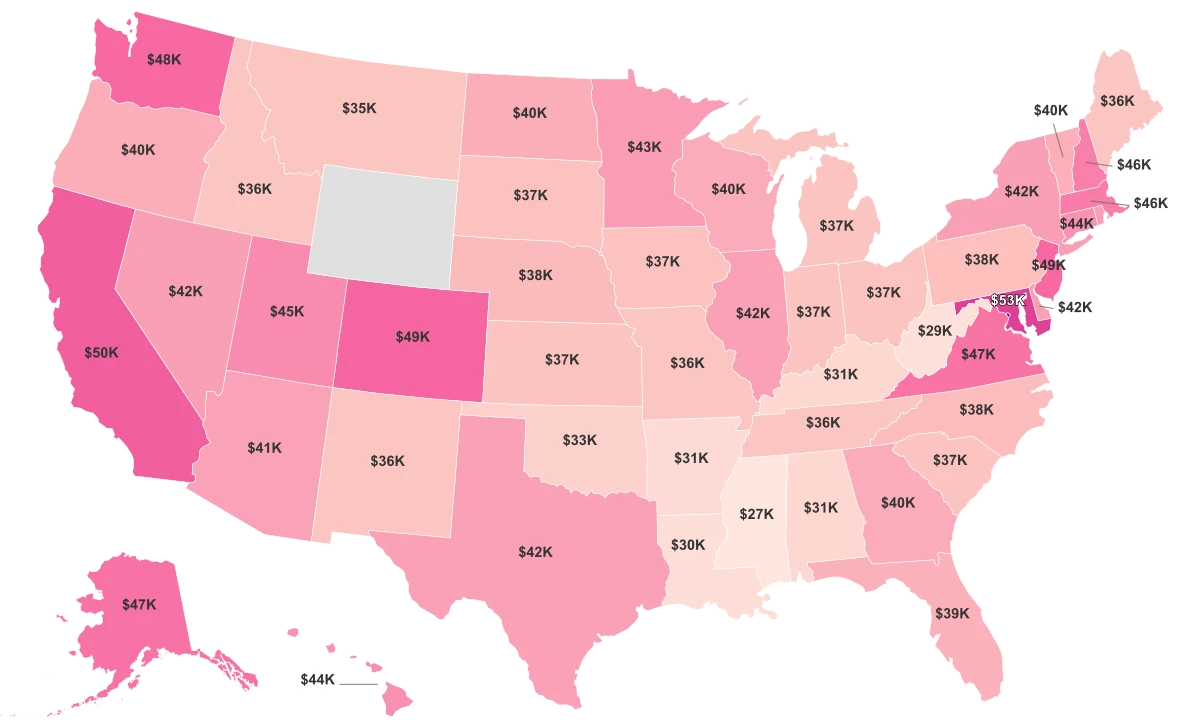
% of the population living below the national poverty line.
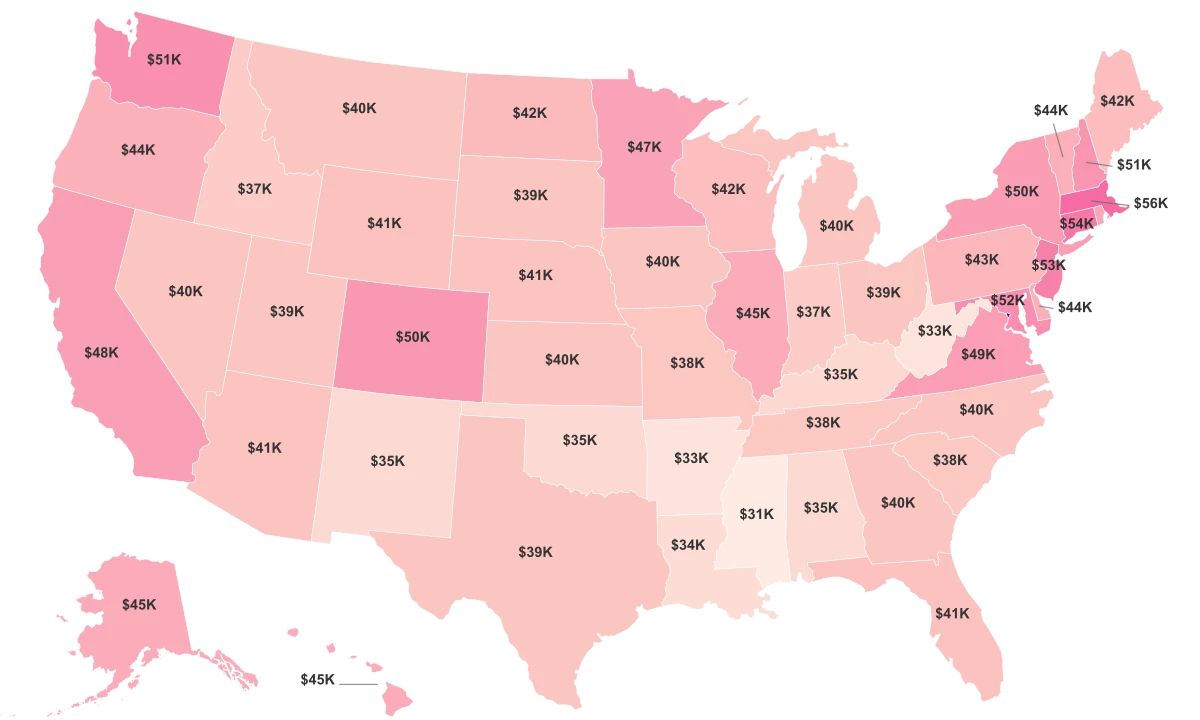
Middle household income value, with half of households earning more and half earning less.
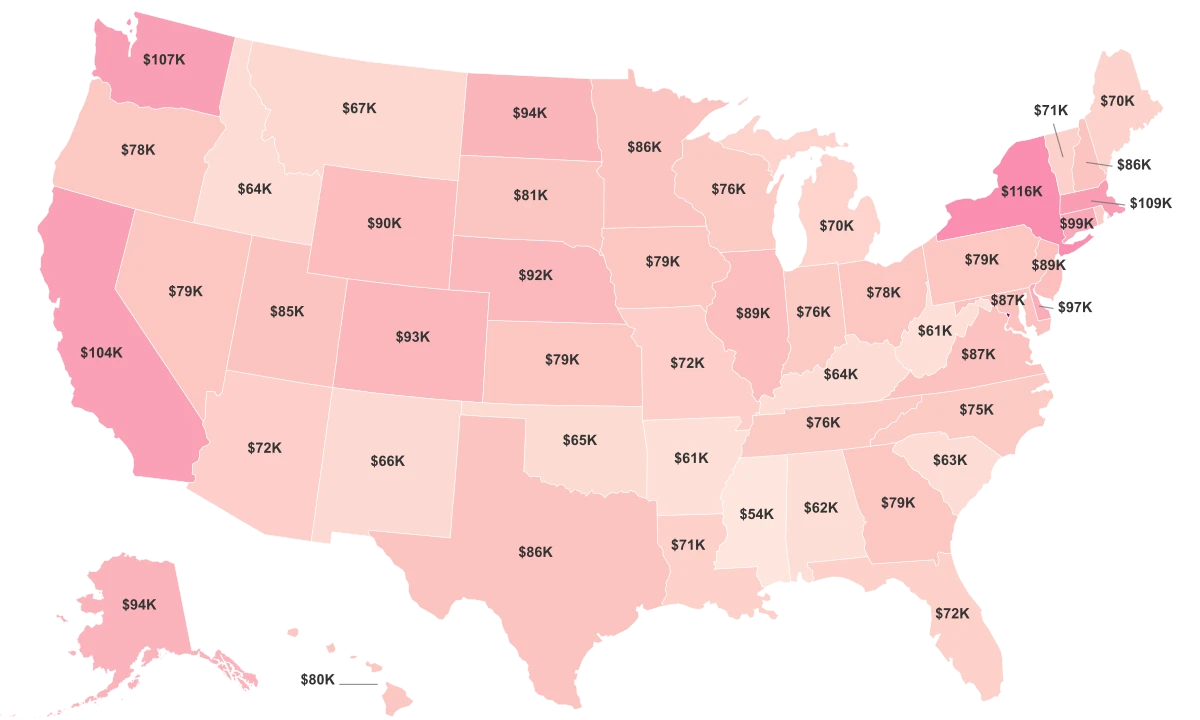
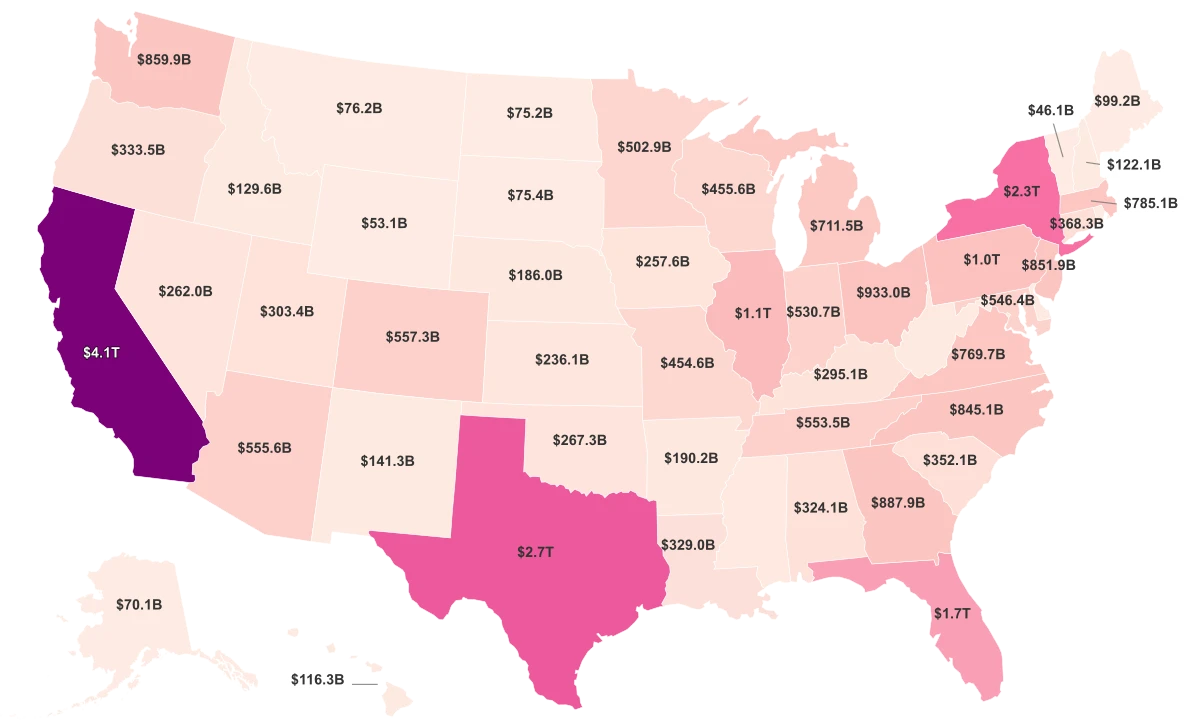
Average total earnings and wages received per person annually.
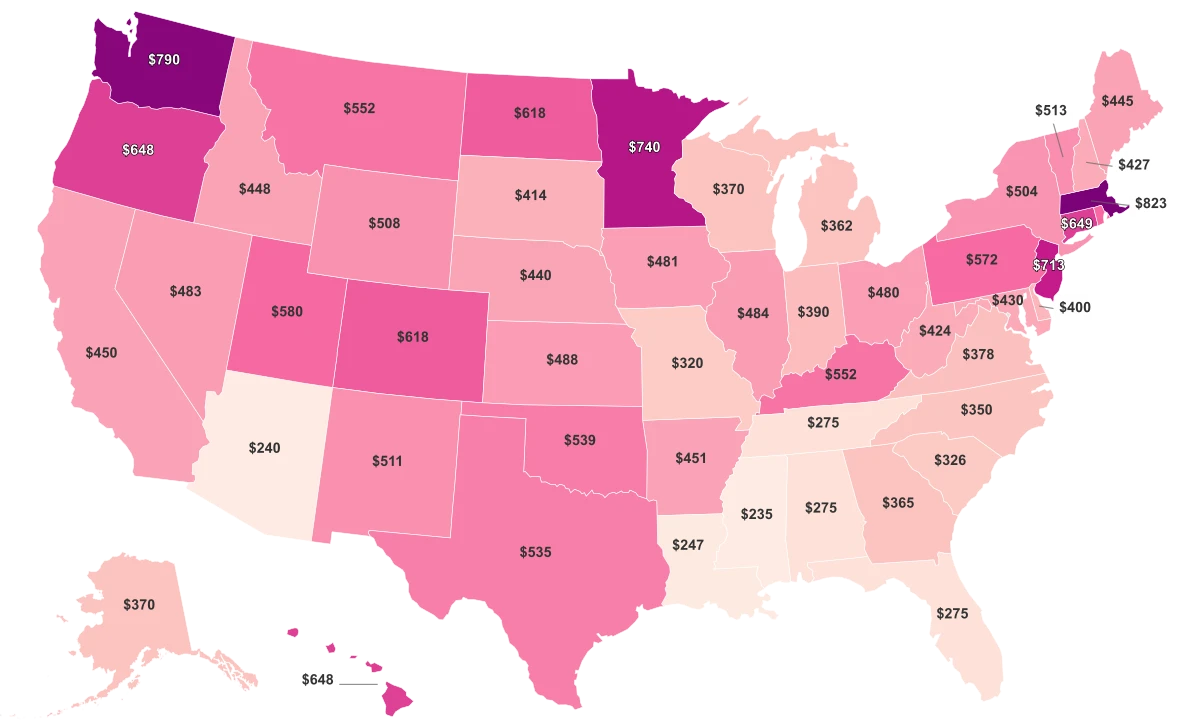
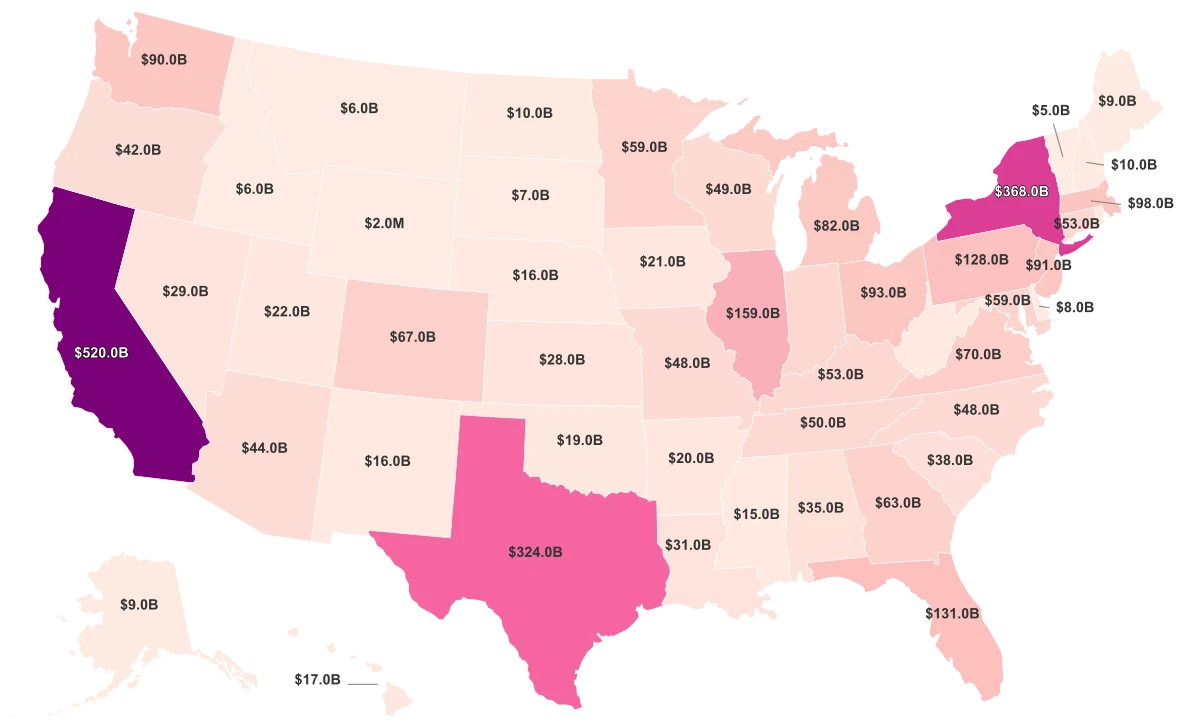
Number of people receiving Supplemental Nutrition Assistance Program (SNAP) benefits.