Oil Consumption by Country

1 |  | United States | 19,000,000bbl |
2 |  | China | 16,400,000bbl |
3 |  | India | 5,600,000bbl |
4 |  | Saudi Arabia | 4,000,000bbl |
5 |  | Russia | 3,800,000bbl |
6 |  | Japan | 3,200,000bbl |
7 |  | South Korea | 2,900,000bbl |
8 |  | Brazil | 2,600,000bbl |
9 |  | Canada | 2,300,000bbl |
10 |  | Germany | 2,100,000bbl |
11 |  | Iran | 2,000,000bbl |
12 |  | Mexico | 1,900,000bbl |
13 |  | Indonesia | 1,600,000bbl |
14 |  | Singapore | 1,500,000bbl |
15 |  | France | 1,400,000bbl |
16 |  | Spain | 1,300,000bbl |
16 |  | Italy | 1,300,000bbl |
16 |  | United Kingdom | 1,300,000bbl |
16 |  | Thailand | 1,300,000bbl |
20 |  | Turkey | 1,200,000bbl |
20 |  | United Arab Emirates | 1,200,000bbl |
22 |  | Australia | 1,100,000bbl |
23 |  | Malaysia | 934,400bbl |
24 |  | Iraq | 924,800bbl |
25 |  | Taiwan | 823,900bbl |
26 |  | Netherlands | 784,700bbl |
27 |  | Egypt | 781,700bbl |
28 |  | Vietnam | 706,900bbl |
29 |  | Poland | 704,700bbl |
30 |  | Argentina | 604,300bbl |
31 |  | Belgium | 577,000bbl |
32 |  | Kuwait | 519,200bbl |
33 |  | Philippines | 486,600bbl |
34 |  | South Africa | 466,600bbl |
35 |  | Algeria | 461,400bbl |
36 |  | Colombia | 449,000bbl |
37 |  | Chile | 428,100bbl |
38 |  | Pakistan | 423,800bbl |
39 |  | Qatar | 397,300bbl |
40 |  | Kazakhstan | 346,300bbl |
41 |  | Venezuela | 325,100bbl |
42 |  | Morocco | 315,800bbl |
43 |  | Hong Kong | 304,600bbl |
44 |  | Greece | 298,300bbl |
45 |  | Ecuador | 290,300bbl |
46 |  | Peru | 279,600bbl |
47 |  | Bangladesh | 264,400bbl |
48 |  | Sweden | 248,700bbl |
49 |  | Romania | 242,200bbl |
50 |  | Austria | 228,200bbl |
51 |  | Norway | 222,200bbl |
52 |  | Oman | 217,400bbl |
53 |  | Portugal | 213,100bbl |
54 |  | Israel | 206,900bbl |
55 |  | Ukraine | 206,000bbl |
56 |  | Czech Republic | 199,500bbl |
57 |  | Switzerland | 188,000bbl |
58 |  | Hungary | 170,600bbl |
59 |  | Turkmenistan | 162,400bbl |
60 |  | Belarus | 161,900bbl |
61 |  | New Zealand | 158,100bbl |
62 |  | Denmark | 157,100bbl |
62 |  | Finland | 157,100bbl |
64 |  | Ireland | 148,700bbl |
65 |  | Uzbekistan | 137,300bbl |
66 |  | Azerbaijan | 128,200bbl |
67 |  | Sri Lanka | 115,500bbl |
68 |  | Bulgaria | 108,600bbl |
69 |  | Slovakia | 85,300bbl |
70 |  | Croatia | 81,200bbl |
71 |  | Lithuania | 64,100bbl |
72 |  | Cyprus | 49,200bbl |
73 |  | Luxembourg | 48,200bbl |
74 |  | Slovenia | 45,200bbl |
75 |  | Trinidad and Tobago | 33,200bbl |
76 |  | Latvia | 32,400bbl |
77 |  | Estonia | 25,900bbl |
78 |  | North Macedonia | 24,500bbl |
79 |  | Iceland | 19,600bbl |
Last updated June 25, 2026
Key Takeaways
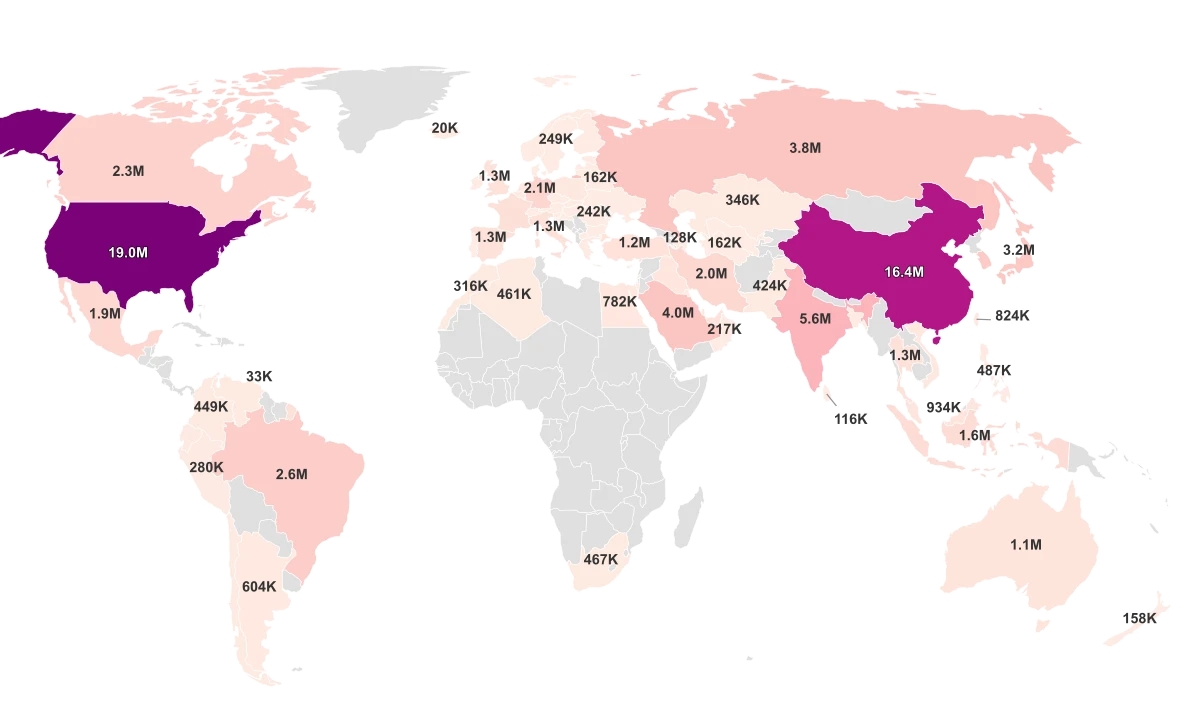
- The United States burns the most oil of any country, about 19.0 million barrels a day in 2024.
- Iceland burns the least in the dataset, roughly 19,600 barrels a day.
- The five biggest consumers account for just over half of all the oil burned across these 79 countries.
- The world's largest reserves sit in Venezuela and Saudi Arabia, neither of which is anywhere near the top of the consumption table.
All Metrics
Every Day the World Burns Nearly 100 Million Barrels of Oil
Add up every country in this ranking and the world goes through roughly 96 million barrels of oil a day. That is the scale of the thing: a daily flow of fuel large enough to run the planet's cars, trucks, ships, planes, and plastics factories, counted one country at a time. The figures come from the U.S. Energy Information Administration's International Energy Statistics, which tracks total oil consumption in barrels per day, here for the 2024 data year across 79 countries.
The direct answer to the title is short. The United States burns the most, about 19.0 million barrels a day, and Iceland the least, around 19,600. This is total volume, not a per-person rate, so the ranking mostly reflects how big a country's vehicle fleet, freight network, and industrial base are. A country near the top is not living harder or worse than one near the bottom; it is simply larger and busier in the ways that consume fuel.
One more thing helps when reading the table below. The numbers describe oil "consumed," but the EIA does not knock on doors to count barrels. It estimates consumption from the supply side, a method it calls "product supplied," which is why the figures are best read as careful estimates rather than exact tallies.
Two Countries, a Third of the World's Oil
Oil consumption is not spread thinly across the globe. It piles up at the top. Just the five biggest consumers account for just over half, about 51%, of all the oil burned across these 79 countries. The reason is two enormous economies sitting in first and second place.
The United States and China are the twin giants of the table. Together they burn more than a third of the world's oil, and no third country comes close. India ranks third at about 5.6 million barrels a day, which sounds large until you set it against the U.S. figure: India burns less than a third of what America does. After the top handful, the numbers fall away fast.
That steep drop is the real shape of this data. The typical country in the ranking burns only a few hundred thousand barrels a day, far below what the raw average suggests, because the average is pulled upward by the giants at the top. Most of the world, in other words, lives in the long tail, not near the headline number.
Why the two largest economies dominate comes down to what oil actually fuels. The EIA notes that transportation is the single largest use of petroleum, with motor gasoline alone making up about 43% of U.S. petroleum use, and the petrochemical industry burning oil as a feedstock for plastics. Big fleets and big factories mean big consumption. The International Energy Agency frames the next chapter of demand as an "eastward shift to non-OECD Asia, especially China and India," which is why those two keep climbing while richer, slower-growing economies hold steady.
Burning Oil and Pumping It Are Different Jobs
It is tempting to assume the countries that burn the most oil are the ones that pump the most. The data says otherwise. Burning oil and producing it are largely separate stories, connected loosely at best.
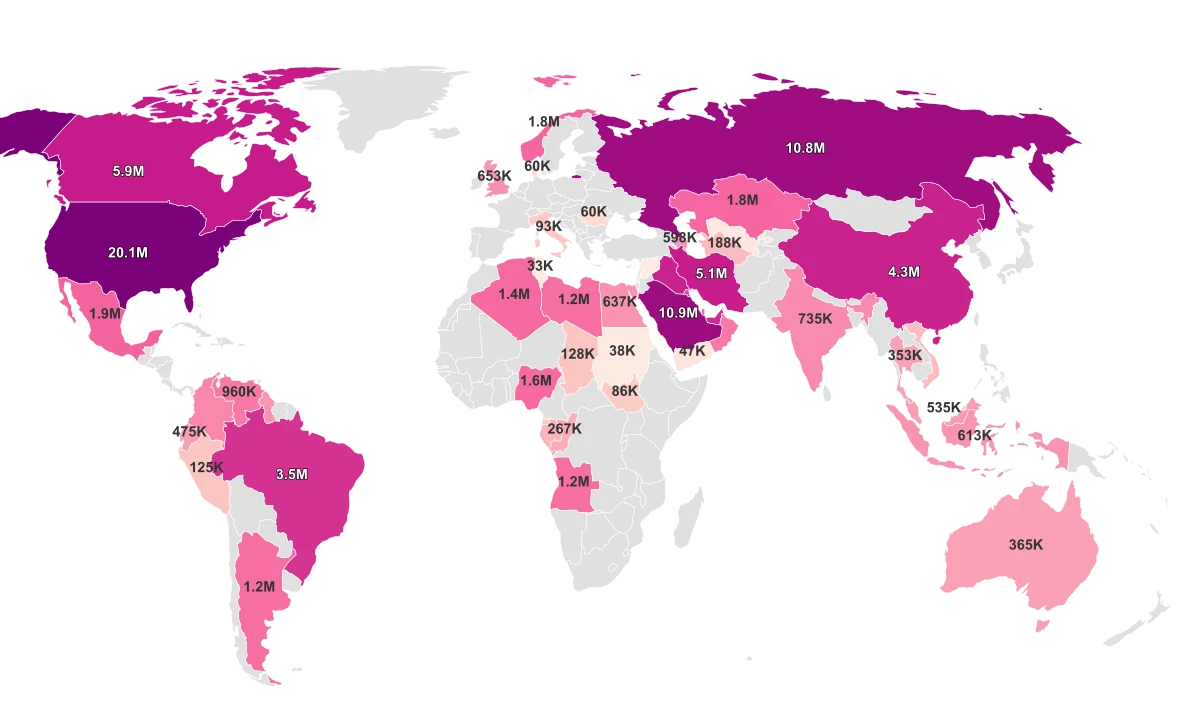
Across the countries that report both figures, production explains only about half of the variation in consumption. The two track in the same general direction, but the link is far from one-to-one. China is the clearest break: it burns roughly 16.4 million barrels a day while producing only about 4.3 million. India burns 5.6 million against just 735,000 pumped. These are heavy consumers that buy most of what they use on world markets.
The Biggest Oil Burners Are Mostly Not the Biggest Oil Pumpers
The United States tops both lists, but China and India burn far more oil than they produce.
The exception sits at the very top. The United States leads in consumption and in production, pumping about 20.1 million barrels a day, slightly more than it burns. That is a recent development. Driven by shale and tight-oil output, the U.S. became a net petroleum exporter in 2020, for the first time in roughly seven decades. Most of the other heavy consumers, including China, India, Japan, and Germany, remain large importers, covering their appetite with oil produced somewhere else.
The Countries Sitting on the Most Oil Barely Crack the Top
There is a common assumption that the countries with the most oil in the ground are the ones using the most of it. The ranking flatly contradicts that. Sitting on oil and burning it turn out to be essentially unrelated.
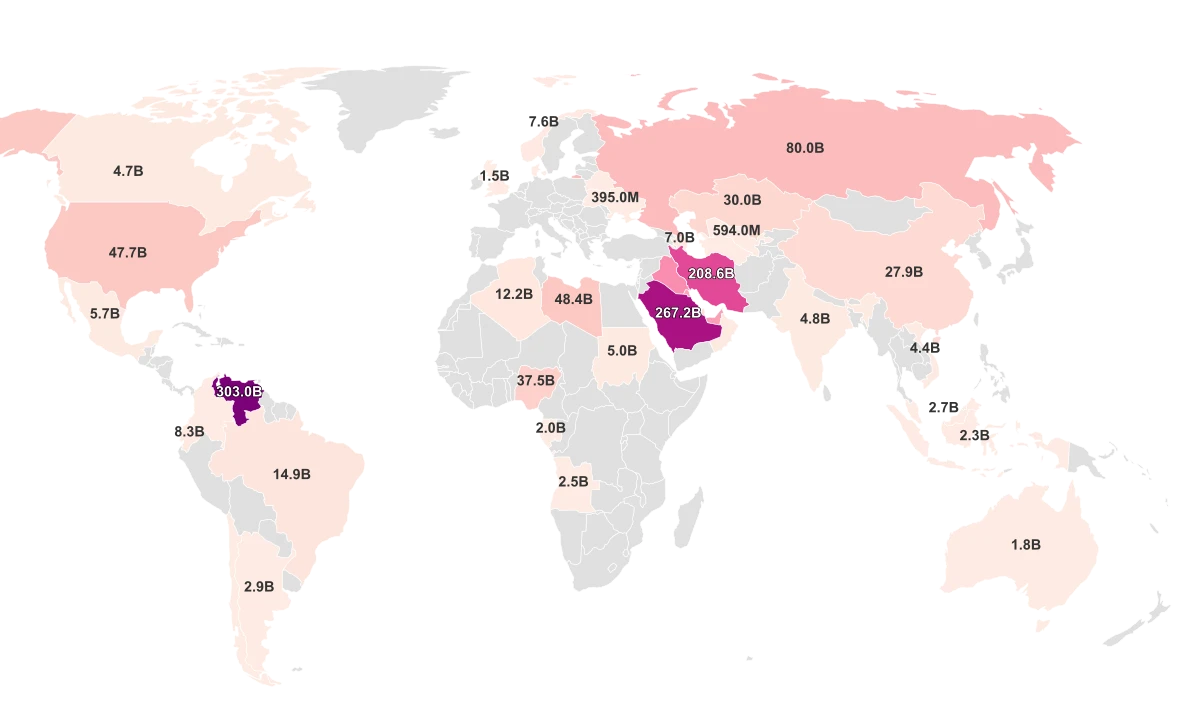
The two countries with the world's largest proved reserves are Venezuela, with about 303 billion barrels, and Saudi Arabia, with roughly 267 billion. Neither is anywhere near the top of the consumption table. Reserves cluster in OPEC and the Persian Gulf, far from the big consumer economies: the EIA reports that OPEC members held about 72% of the world's proved reserves at the start of 2021. How much oil a country owns says almost nothing about how much it burns.
What These Barrel Counts Actually Measure
These numbers are solid, but they are estimates, and it is worth knowing how they are built before drawing firm conclusions. The EIA does not directly survey oil use. It calculates "product supplied," a supply-side proxy that adds up refinery output and imports, then subtracts exports and stock changes. The result stands in for consumption, and it is the standard way national oil use is measured.
There is also a wrinkle in the dataset's own labeling worth flagging plainly. These figures are dated 2024, and the underlying consumption series carried no source attached to it in the raw data, so the numbers are attributed here to the EIA and the Energy Institute's Statistical Review of World Energy, the two Tier-1 authorities that publish this series. The EIA's own most recent published top-consumers table is for 2022, where it lists the United States at 20.01 million barrels a day and China at 15.15 million.
That gap is not an error. The 2024 figures here, the U.S. near 19.0 million and China near 16.4 million, sit squarely inside the trend the EIA documents: U.S. demand drifting down from its 2022 level and Chinese demand rising. Read them as a current snapshot of two economies moving in opposite directions, not as numbers that should match a table built on an earlier year.
Sources & Notes
Total estimated barrels of oil reserves.