Most Technologically Advanced Countries

1 |  | Switzerland | 67.5 |
2 |  | Sweden | 64.5 |
3 |  | United States | 62.4 |
4 |  | Singapore | 61.2 |
5 |  | United Kingdom | 61 |
6 |  | South Korea | 60.9 |
7 |  | Finland | 59.4 |
8 |  | Netherlands | 58.8 |
9 |  | Germany | 58.1 |
10 |  | Denmark | 57.1 |
11 |  | China | 56.3 |
12 |  | France | 55.4 |
13 |  | Japan | 54.1 |
14 |  | Canada | 52.9 |
15 |  | Israel | 52.7 |
16 |  | Estonia | 52.3 |
17 |  | Austria | 50.3 |
18 |  | Hong Kong | 50.1 |
19 |  | Ireland | 50 |
20 |  | Norway | 49.1 |
20 |  | Luxembourg | 49.1 |
22 |  | Iceland | 48.5 |
23 |  | Australia | 48.1 |
24 |  | Belgium | 47.7 |
25 |  | New Zealand | 45.9 |
26 |  | Italy | 45.3 |
27 |  | Cyprus | 45.1 |
28 |  | Spain | 44.9 |
29 |  | Malta | 44.8 |
30 |  | Czech Republic | 44 |
31 |  | Portugal | 43.7 |
32 |  | United Arab Emirates | 42.8 |
33 |  | Malaysia | 40.5 |
34 |  | Slovenia | 40.2 |
35 |  | Lithuania | 40.1 |
36 |  | Hungary | 39.6 |
37 |  | Turkey | 39 |
38 |  | Bulgaria | 38.5 |
39 |  | India | 38.3 |
40 |  | Poland | 37 |
41 |  | Thailand | 36.9 |
42 |  | Latvia | 36.4 |
43 |  | Croatia | 36.3 |
44 |  | Greece | 36.2 |
44 |  | Vietnam | 36.2 |
46 |  | Slovakia | 34.3 |
47 |  | Saudi Arabia | 33.9 |
48 |  | Romania | 33.4 |
49 |  | Qatar | 32.9 |
50 |  | Brazil | 32.7 |
51 |  | Chile | 32.6 |
52 |  | Serbia | 32.3 |
53 |  | Philippines | 31.1 |
54 |  | Mauritius | 30.6 |
54 |  | Indonesia | 30.6 |
56 |  | Mexico | 30.4 |
56 |  | Georgia | 30.4 |
58 |  | North Macedonia | 29.9 |
59 |  | Russia | 29.7 |
60 |  | Ukraine | 29.5 |
61 |  | Colombia | 29.2 |
62 |  | Uruguay | 29.1 |
63 |  | Armenia | 29 |
64 |  | Montenegro | 28.9 |
64 |  | Iran | 28.9 |
66 |  | Morocco | 28.8 |
67 |  | Moldova | 28.7 |
67 |  | Mongolia | 28.7 |
69 |  | Costa Rica | 28.3 |
69 |  | South Africa | 28.3 |
71 |  | Kuwait | 28.1 |
72 |  | Bahrain | 27.6 |
73 |  | Jordan | 27.5 |
74 |  | Oman | 27.1 |
75 |  | Peru | 26.7 |
76 |  | Argentina | 26.4 |
77 |  | Barbados | 26.1 |
78 |  | Jamaica | 25.7 |
78 |  | Kazakhstan | 25.7 |
80 |  | Bosnia and Herzegovina | 25.5 |
81 |  | Tunisia | 25.4 |
82 |  | Panama | 24.7 |
82 |  | Uzbekistan | 24.7 |
84 |  | Albania | 24.5 |
85 |  | Belarus | 24.2 |
86 |  | Egypt | 23.7 |
87 |  | Botswana | 23.1 |
88 |  | Brunei | 22.8 |
89 |  | Sri Lanka | 22.6 |
90 |  | Cape Verde | 22.3 |
91 |  | Pakistan | 22 |
91 |  | Senegal | 22 |
93 |  | Paraguay | 21.9 |
94 |  | Lebanon | 21.5 |
95 |  | Azerbaijan | 21.3 |
96 |  | Kenya | 21 |
97 |  | Dominican Republic | 20.8 |
98 |  | El Salvador | 20.6 |
99 |  | Kyrgyzstan | 20.4 |
100 |  | Bolivia | 20.2 |
101 |  | Ghana | 20 |
101 |  | Namibia | 20 |
103 |  | Cambodia | 19.9 |
104 |  | Rwanda | 19.7 |
105 |  | Ecuador | 19.3 |
106 |  | Bangladesh | 19.1 |
107 |  | Tajikistan | 18.6 |
108 |  | Trinidad and Tobago | 18.4 |
109 |  | Nepal | 18.1 |
110 |  | Madagascar | 17.9 |
111 |  | Laos | 17.8 |
112 |  | Ivory Coast | 17.5 |
113 |  | Nigeria | 17.1 |
114 |  | Honduras | 16.7 |
115 |  | Algeria | 16.2 |
116 |  | Zambia | 15.7 |
117 |  | Zimbabwe | 15.6 |
117 |  | Togo | 15.6 |
119 |  | Benin | 15.4 |
120 |  | Tanzania | 15.3 |
121 |  | Uganda | 14.9 |
122 |  | Guatemala | 14.6 |
123 |  | Cameroon | 14.4 |
124 |  | Nicaragua | 14 |
125 |  | Myanmar | 13.8 |
126 |  | Mauritania | 13.2 |
126 |  | Burundi | 13.2 |
128 |  | Mozambique | 13.1 |
129 |  | Burkina Faso | 12.8 |
130 |  | Ethiopia | 12.3 |
131 |  | Mali | 11.8 |
132 |  | Niger | 11.2 |
133 |  | Angola | 10.2 |
Last updated June 24, 2026
Key Takeaways
- Switzerland leads the 2024 Innovation Index with a score of 67.5, its strongest result on a 0-to-100 scale that rates each country's overall innovation capacity.
- Angola sits at the bottom of the 133 ranked economies at 10.2, leaving the top score more than six times the lowest.
- Six economies stand far above the rest of the field, enough that the world's average country scores below the global average.
- The country with the fastest broadband and the countries that build most of the world's chips are not the ones that top the innovation ranking.
All Metrics
What the Innovation Index Actually Measures, and Who Sits on Top
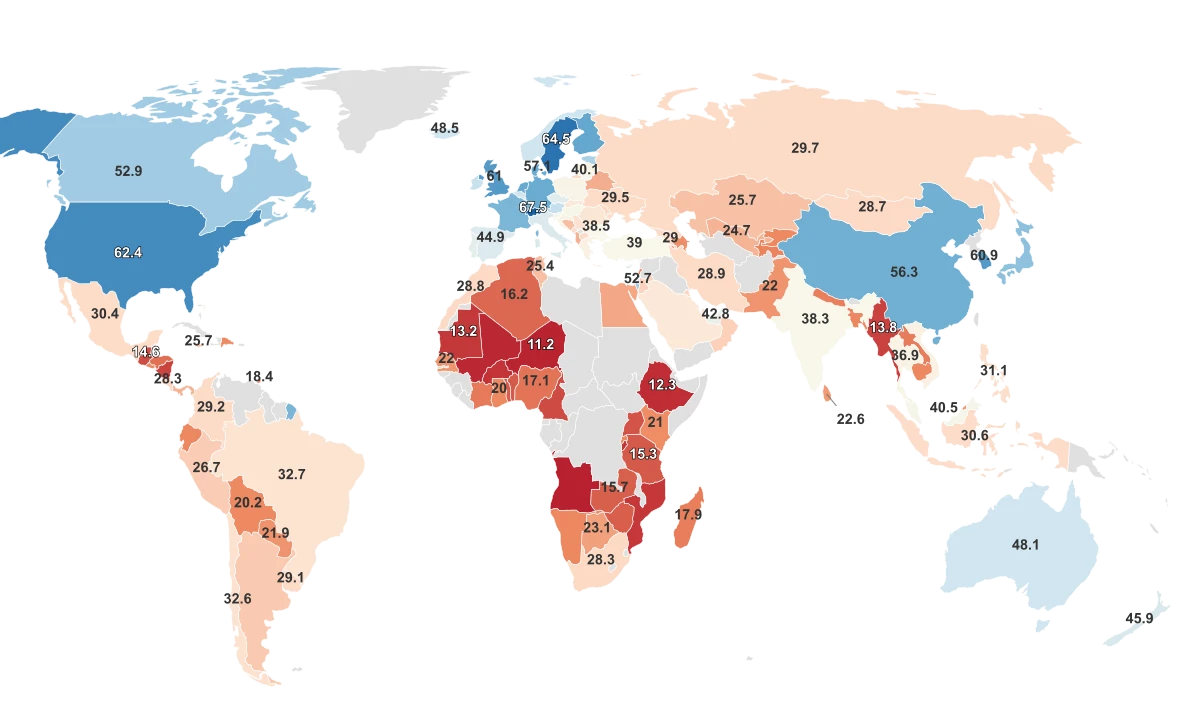
Ask which country is the most technologically advanced and you will get a different answer depending on what you count. This ranking uses the Global Innovation Index, published in 2024 by the World Intellectual Property Organization, a United Nations agency. Switzerland leads at 67.5 and Angola trails the field at 10.2, with 133 economies ranked in between. A higher score means greater innovation capacity, not a verdict that daily life there is more futuristic.
The number is a composite, not a single measurement. WIPO builds each score as the average of two equally weighted halves, one covering the inputs an economy puts into innovation and one covering the outputs it gets back, drawn from seven pillars and 78 separate indicators scored from 0 to 100. WIPO is explicit that it no longer treats innovation as something confined to research labs and scientific papers, which is why the leaderboard is not simply a ranking of who spends the most on research or runs the most factories.
That breadth matters before reading a single rank. The index covers 133 economies, so it speaks to the ranked world rather than all of the roughly 200 places people might name, and the score it assigns is a measure of capacity built from dozens of moving parts. Everything that follows sits on top of that definition.
A Handful of Economies Pull the World's Average Up
The leaderboard is not a smooth slope from best to worst. It is a short, steep peak followed by a long descent, and the peak is crowded with a familiar set of names. Switzerland, Sweden and the United States hold the three highest scores, and Switzerland's 67.5 is more than six times Angola's 10.2 at the floor. WIPO reports that Switzerland has ranked first for the 14th consecutive year, which tells you the gap is structural rather than a single good year.
Six economies break far enough above the rest of the field to count as genuine standouts: Switzerland, Sweden and the United States, then Singapore, the United Kingdom and South Korea. Switzerland, Sweden and the US sit furthest out, but all six clear the same wide margin over the pack, so this is a leading group rather than a lone frontrunner. Below them the scores fall away quickly and then crowd together.
That crowding has a strange effect on the average. The world's mean score lands near 31, yet the typical ranked country sits closer to 29, which means the average country actually scores below average. The handful of leaders is heavy enough to drag the mean up past where most of the world really lives.
Underneath the cluster is money spent on research. In the European Union the highest research intensity in 2023 belonged to Sweden at 3.6% of its economy, with a small group of northern and central European countries above 3%, the same economies that crowd the index's top tier. At the other end, the EU's innovation laggards reported research spending below 1% of their economies, led by Romania at 0.5%, and that thin funding deepens further down the global table where the lowest scores concentrate among lower-income and Sub-Saharan economies.
Why the Fastest Internet Isn't Where the Innovation Is
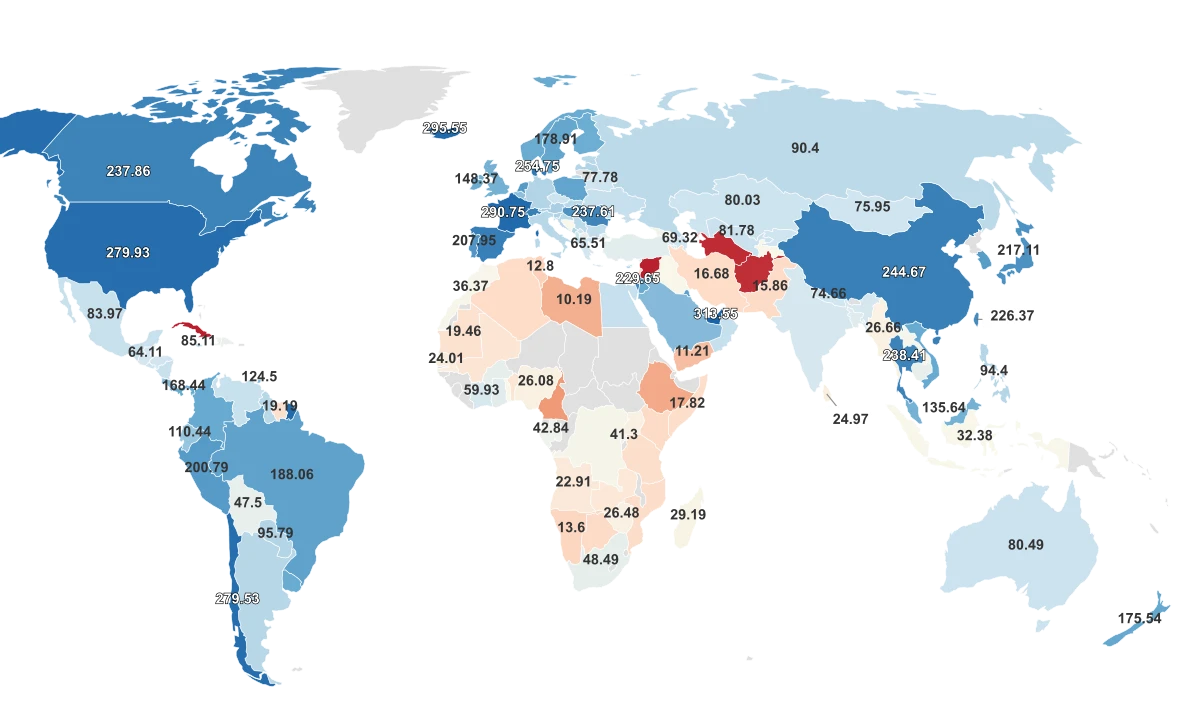
It is tempting to assume the most advanced country has the fastest internet. Across the ranked world the two do move together: a country's broadband speed accounts for roughly half of the variation in its innovation score, the single strongest relationship in this data, and faster pipes reliably go with higher scores. The instinct is not wrong, it is just incomplete.
The exceptions live at the very top. Switzerland leads the world on innovation but ranks only 10th for broadband speed, at about 245 Mbps. The speed crown belongs to Singapore, at roughly 345 Mbps, with the United Arab Emirates and Hong Kong close behind, and none of those three comes near the top of the innovation table. The fastest connections and the most innovative economies are largely different places.
Faster Internet Tracks With Innovation, Except at the Very Top
Broadband speed and innovation capacity rise together across 130 countries, yet the speed leaders and the innovation leaders are mostly different economies.
WIPO's own framework explains why. Infrastructure, the pillar that captures the pipes, is just one of five input categories, and inputs are only half of the final score. Switzerland tops the index while ranking only 7th on that Infrastructure pillar, carried instead by what it produces. Singapore is the mirror image: WIPO notes it leads the world on more individual indicators than any other economy and has surpassed the top three on innovation inputs, yet the gap to the leaders "remains large in innovation outputs." Raw capacity, including a fast network, turns out to be necessary scaffolding rather than the finished building.
Sheer scale tells the same story. China counts roughly 1.9 billion mobile internet connections and India about 898.6 million, dwarfing the United States at 679.5 million, but volume of users does not reorder the innovation table, where the US outranks both. Being big, or being fast, is not the same as being inventive.
The World's Chip Factories Sit in Five Countries, and They're Not the Innovation Leaders
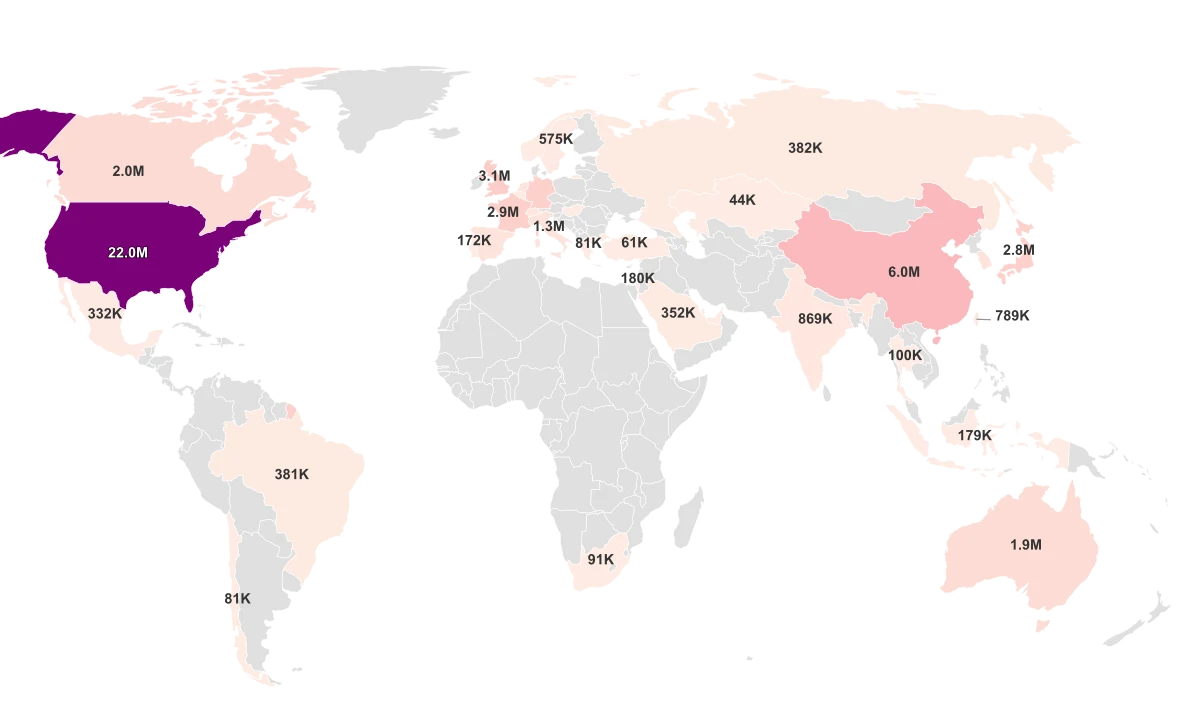
If anything looks like the physical heart of advanced technology, it is the semiconductor plant. So the natural guess is that the countries making the chips are the ones leading innovation. The data does not cooperate. Just five countries, Japan, the United States, China, Taiwan and Germany, host about 75% of the world's catalogued fabrication plants, with Japan alone holding 103 of them.
Line that list up against the innovation leaders and it barely matches. Switzerland and Sweden, the two highest-scoring economies on innovation, each appear with just a single plant, while Japan and Taiwan, which together anchor the world's chip supply chain, hold dozens. Across the countries that report fab counts, the number of plants a country runs bears no statistically reliable relationship to its innovation score, so building the chips and topping the index are simply different achievements.
One caveat keeps this honest. The fabrication-plant figures come from a crowd-sourced Wikipedia list that covers only 35 countries, so the concentration is real but the precise tally is softer than the WIPO and broadband sources behind the rest of this ranking. It is enough to show where chip-making clusters, and enough to show that the map of factories is not the map of innovation.
Sources & Notes
Rating of countries based on technological advancement levels.
Mean internet speed for fixed locations based on internet speed testing scores.
Total number of semiconductor fabrication plants.
Refers to the sum of active handset-based and computer-based (USB/dongles) mobile-broadband subscriptions that allow access to the Internet.