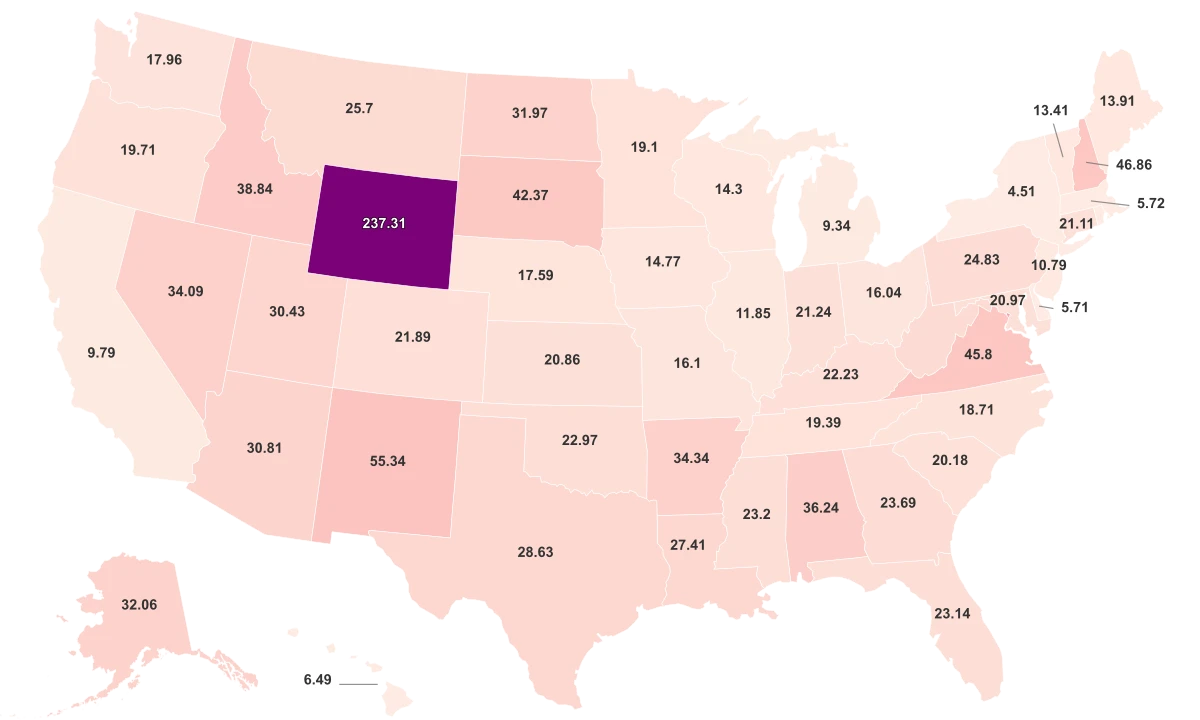
Most Redneck States

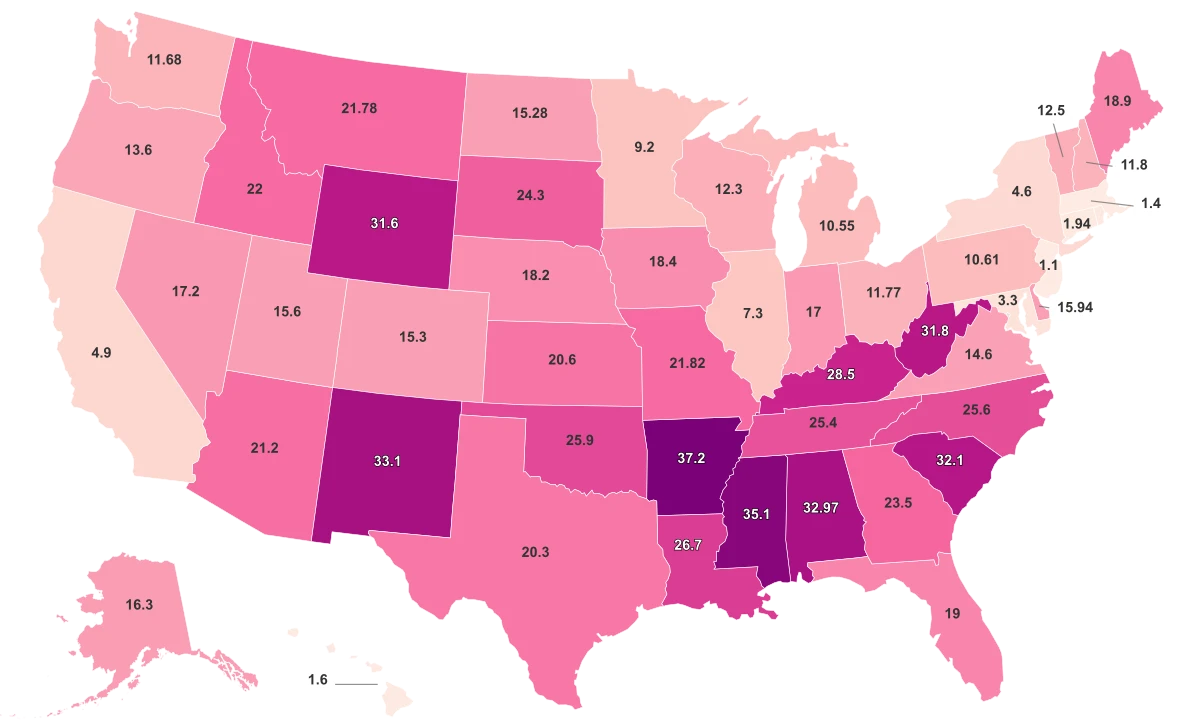
1 | Arkansas | 37.2 | |
2 | Mississippi | 35.1 | |
3 | New Mexico | 33.1 | |
4 | Alabama | 32.97 | |
5 | South Carolina | 32.1 | |
6 | West Virginia | 31.8 | |
7 | Wyoming | 31.6 | |
8 | Kentucky | 28.5 | |
9 | Louisiana | 26.7 | |
10 | Oklahoma | 25.9 | |
11 | North Carolina | 25.6 | |
12 | Tennessee | 25.4 | |
13 | South Dakota | 24.3 | |
14 | Georgia | 23.5 | |
15 | Idaho | 22 | |
16 | Missouri | 21.82 | |
17 | Montana | 21.78 | |
18 | Arizona | 21.2 | |
19 | Kansas | 20.6 | |
20 | Texas | 20.3 | |
21 | Florida | 19 | |
22 | Maine | 18.9 | |
23 | Iowa | 18.4 | |
24 | Nebraska | 18.2 | |
25 | Nevada | 17.2 | |
26 | Indiana | 17 | |
27 | Alaska | 16.3 | |
28 | Delaware | 15.94 | |
29 | Utah | 15.6 | |
30 | Colorado | 15.3 | |
31 | North Dakota | 15.28 | |
32 | Virginia | 14.6 | |
33 | Oregon | 13.6 | |
34 | Vermont | 12.5 | |
35 | Wisconsin | 12.3 | |
36 | New Hampshire | 11.8 | |
37 | Ohio | 11.77 | |
38 | Washington | 11.68 | |
39 | Pennsylvania | 10.61 | |
40 | Michigan | 10.55 | |
41 | Minnesota | 9.2 | |
42 | Illinois | 7.3 | |
43 | California | 4.9 | |
44 | New York | 4.6 | |
45 | Maryland | 3.3 | |
46 | Connecticut | 1.94 | |
47 | Rhode Island | 1.93 | |
48 | Hawaii | 1.6 | |
49 | Massachusetts | 1.4 | |
50 | New Jersey | 1.1 |
Last updated April 1, 2026
A Score Built on Walmarts and Mobile Homes
The "Redneck Index" does not measure culture, attitudes, or lifestyle. It counts two things: the number of mobile homes per 100 housing units and the number of Walmart stores per million residents. Those two infrastructure proxies are combined into a single composite score for each state.
Arkansas leads the nation at 37.2. New Jersey sits at the bottom with 1.1. The gap between them is wide enough that the top state scores nearly 34 times higher than the lowest. Mississippi, New Mexico, Alabama, and South Carolina round out the top five, all within a five-point band.
The bottom of the ranking is almost entirely Northeastern. Massachusetts, Hawaii, Rhode Island, and Connecticut all score below 2, clustered just above New Jersey. Most states land in the middle, bunched between 10 and 25.
All Metrics
Why Arkansas Leads and New Mexico Breaks the Mold
Arkansas owes part of its top ranking to a geographic coincidence: Walmart was founded in Bentonville in 1962 and still operates its global headquarters there. More than 1,300 supplier companies have set up offices in Northwest Arkansas to be close to Walmart's buying teams. The state's Walmarts-per-capita figure is inflated by the company's home-state saturation, giving Arkansas a built-in advantage on half the index.
The other half, mobile home density, reflects something more structural. Arkansas has one of the highest rates of manufactured housing in the country, driven by the same forces that explain the rest of the top five: lower median incomes and a housing market where mobile homes fill a gap that traditional construction does not.
New Mexico is the ranking's most counterintuitive entry. It scores 33.1 despite voting Democratic in every presidential election since 2008 and holding one of the lowest conservative policy scores in the dataset. The explanation is poverty, not politics.
The state has roughly 150 colonias, unincorporated communities near the Mexican border where trailer homes sit on lots that sometimes lack sewage or running water. Its poverty rate of 18.2% is the third highest nationally, according to the 2020 Census. The Redneck Index does not know any of that context. It just counts mobile homes.
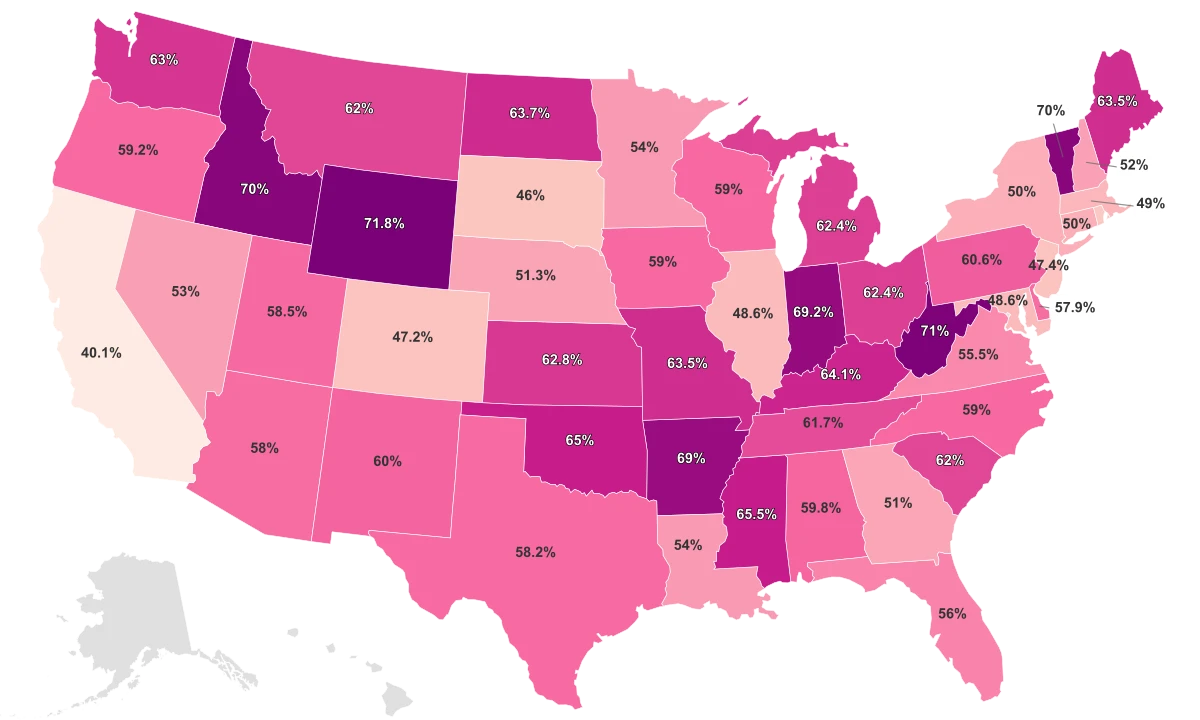
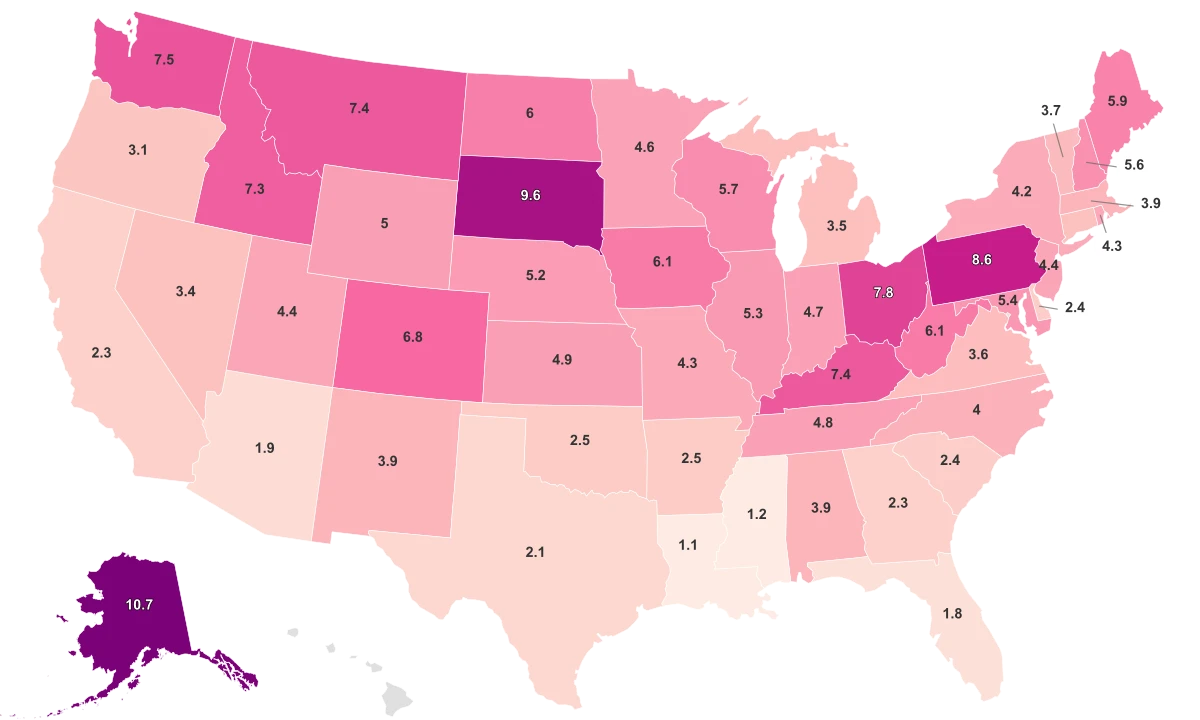
Guns Track Closer Than Politics
Of the three metrics in this dataset, household gun ownership tracks most closely with the Redneck Index. States that score high on mobile homes and Walmarts almost always have high rates of firearm ownership. The relationship holds from top to bottom: Arkansas pairs a 37.2 index score with 57.2% gun ownership, while New Jersey pairs a 1.1 score with just 14.7%.
States With More Walmarts and Mobile Homes Also Own More Guns
Household gun ownership tracks tightly with the Redneck Index across all 50 states, reflecting shared rural and economic roots.
The regional pattern reinforces the connection. Southern states average 24.87 on the index. Northeastern states average 7.2, a 3.5-to-1 gap. The same divide appears in gun ownership: nearly half of Southern households own firearms, compared to fewer than 30% in the Northeast.
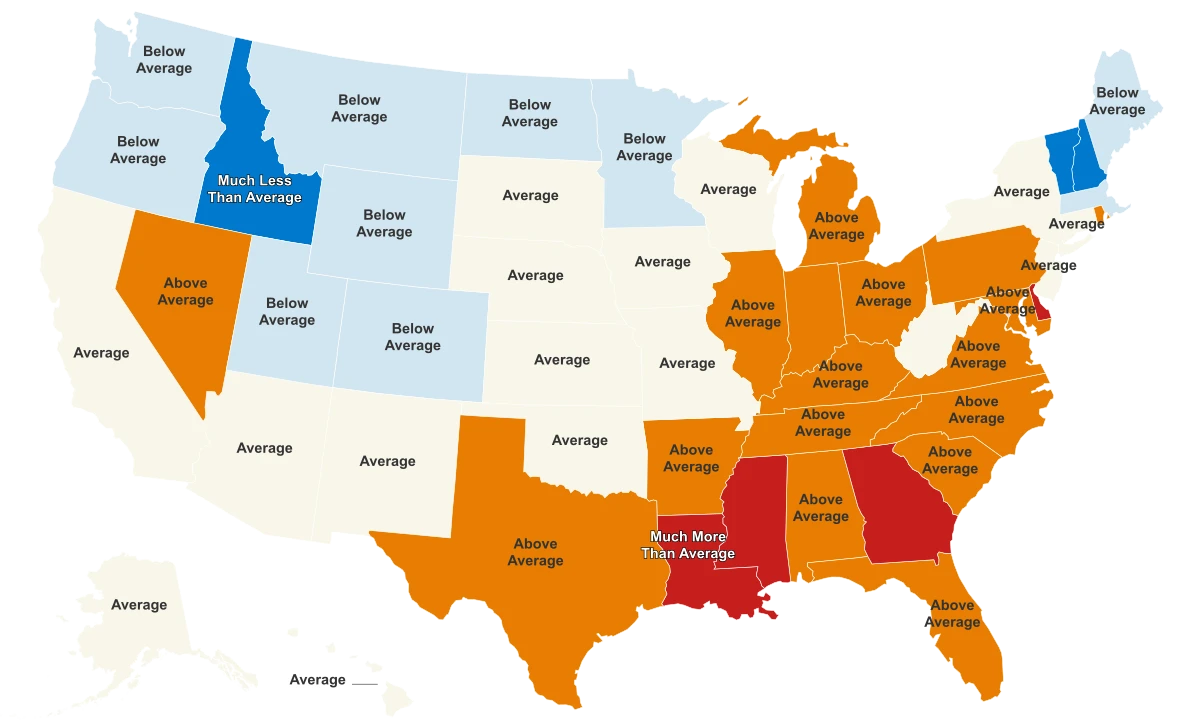
Conservative policy scores tell a messier story. South Carolina ranks fifth on the Redneck Index but lands only 28th on CPAC's conservative legislative ranking. Ohio scores a low 11.77 on the index yet sits among the top 15 most conservative states. The redneck label, at least as this index measures it, is a proxy for how people live rather than how they vote.
What Two Retail Proxies Can and Cannot Tell You
The Redneck Index is an informal ranking created for entertainment, not a government statistic or academic measure. Understanding what it actually captures matters more than taking the scores at face value.
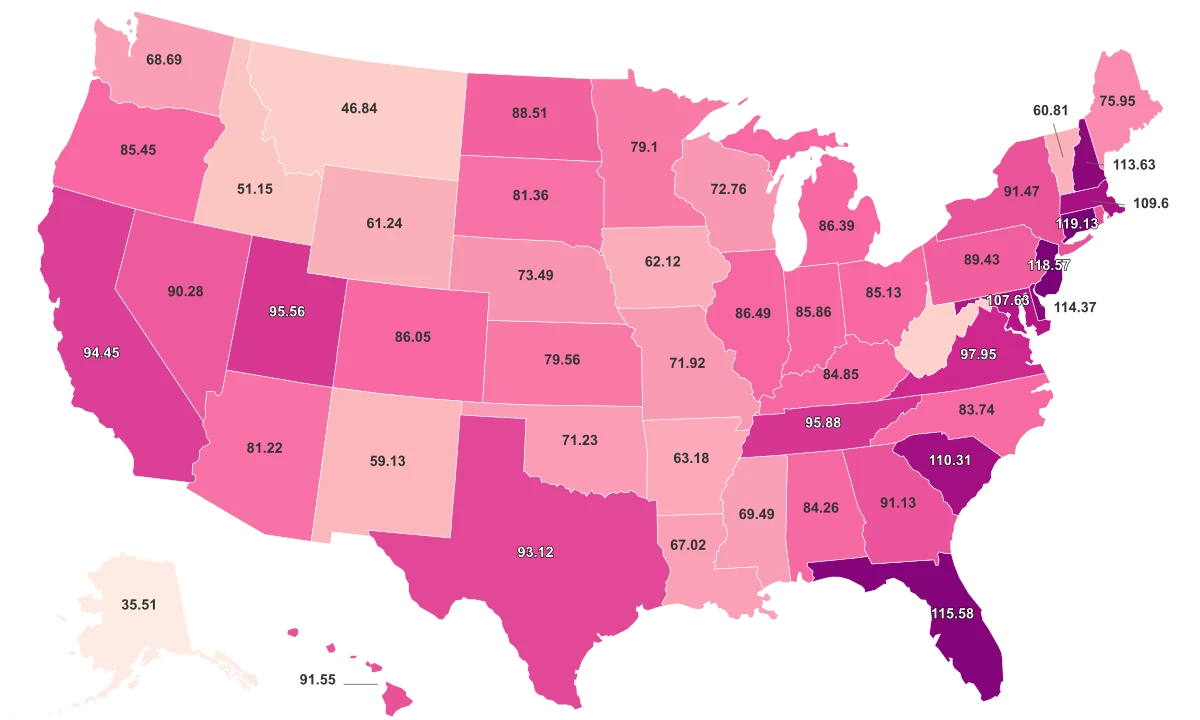
Mobile homes, which the U.S. Census Bureau formally calls "manufactured housing," make up about 5.4% of all occupied housing nationally. They are concentrated in states with lower incomes and less expensive land. A Harvard Business School analysis found that Walmart operates 2.5 times as much selling space per capita in the poorest third of states compared to the richest third. That is not a cultural preference: it is a business strategy built around serving rural and lower-income markets where competitors like Target rarely operate.
Both inputs to the index, then, are proxies for the same underlying condition: rural poverty and the infrastructure that accompanies it. The label "redneck" adds a cultural frame that the data itself does not support. Vermont scores a modest 12.5 on the index yet has gun ownership above 50%, while Maine scores 18.9 and sits higher than Texas. The index measures where discount retail and affordable housing converge, not where any particular cultural identity lives.
Sources & Notes
Score of the Redneckness of a state based on number of mobile homes and Walmarts per capita.
Rating of the states conservative policies.
Percentage of households that own at least one firearm.