Most Racist States


| Alabama | Above Average | ||
| Alaska | Average | ||
| Arizona | Average | ||
| Arkansas | Above Average | ||
| California | Average | ||
| Colorado | Below Average | ||
| Connecticut | Average | ||
| Delaware | Much More Than Average | ||
| Florida | Above Average | ||
| Georgia | Much More Than Average | ||
| Hawaii | Average | ||
| Idaho | Much Less Than Average | ||
| Illinois | Above Average | ||
| Indiana | Above Average | ||
| Iowa | Average | ||
| Kansas | Average | ||
| Kentucky | Above Average | ||
| Louisiana | Much More Than Average | ||
| Maine | Below Average | ||
| Maryland | Above Average | ||
| Massachusetts | Below Average | ||
| Michigan | Above Average | ||
| Minnesota | Below Average | ||
| Mississippi | Much More Than Average | ||
| Missouri | Average | ||
| Montana | Below Average | ||
| Nebraska | Average | ||
| Nevada | Above Average | ||
| New Hampshire | Much Less Than Average | ||
| New Jersey | Average | ||
| New Mexico | Average | ||
| New York | Average | ||
| North Carolina | Above Average | ||
| North Dakota | Below Average | ||
| Ohio | Above Average | ||
| Oklahoma | Average | ||
| Oregon | Below Average | ||
| Pennsylvania | Above Average | ||
| Rhode Island | Above Average | ||
| South Carolina | Above Average | ||
| South Dakota | Average | ||
| Tennessee | Above Average | ||
| Texas | Above Average | ||
| Utah | Below Average | ||
| Vermont | Much Less Than Average | ||
| Virginia | Above Average | ||
| Washington | Below Average | ||
| West Virginia | Average | ||
| Wisconsin | Average | ||
| Wyoming | Below Average |
Last updated April 1, 2026
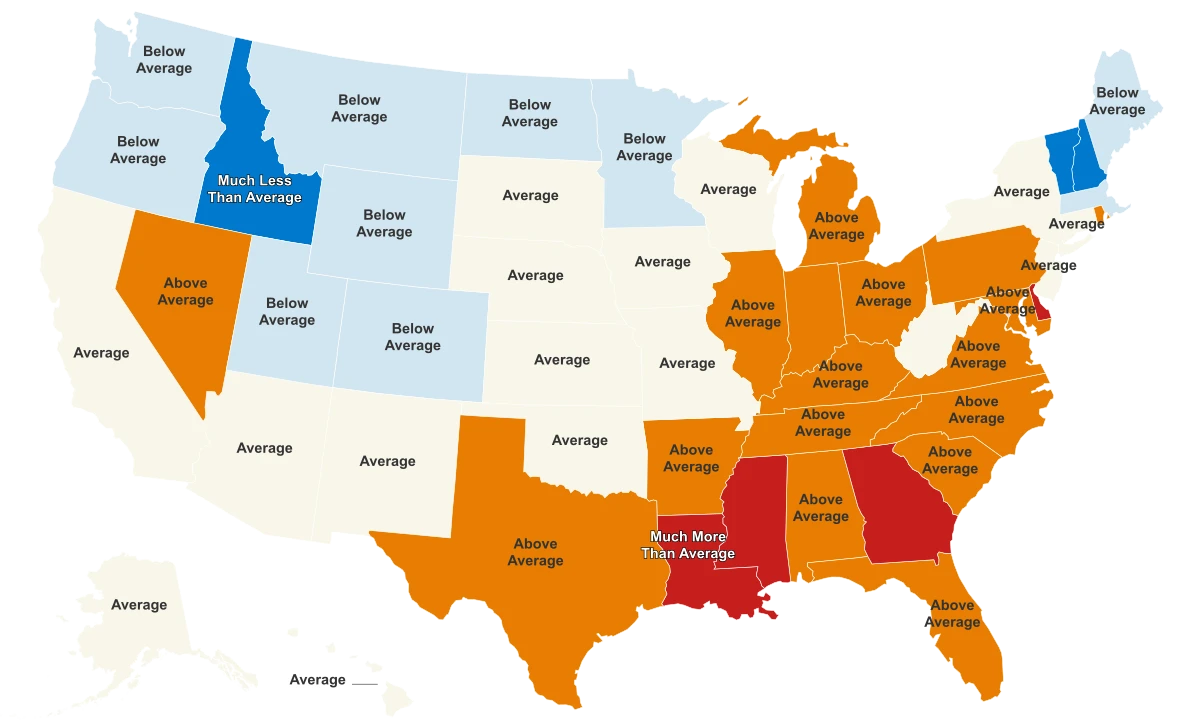
What This Ranking Measures, and What It Cannot
There is no blood test for racism. No census question asks residents to rate their own prejudice. Every attempt to rank states by racism relies on proxies: measurable outcomes like income gaps between racial groups, reported hate crimes, residential segregation patterns, or even the frequency of racial slurs typed into search engines. This ranking is no different. The Racism Index Score used here sorts all 50 states into five tiers, from "Much Less Than Average" to "Much More Than Average," based on the weight of those indirect indicators.
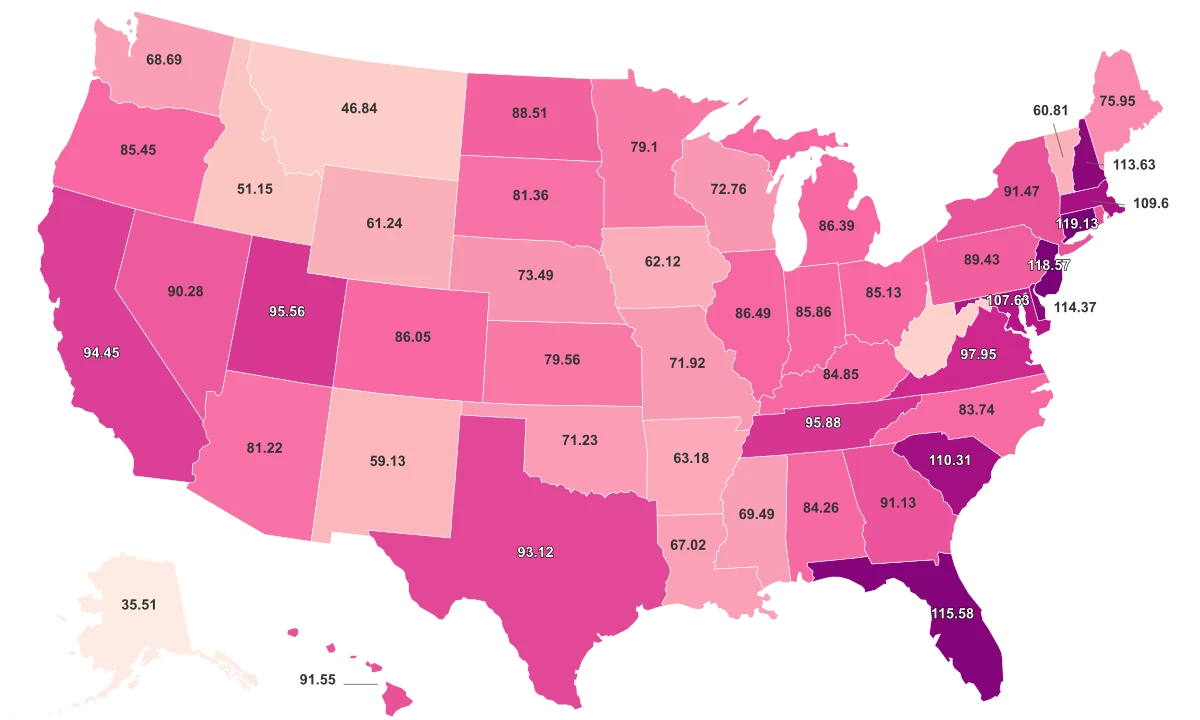
Four states sit in the highest tier. Mississippi, Louisiana, Georgia, and Delaware are all labeled "Much More Than Average." The first three share a common thread: they are former slave states in the Deep South with Black populations exceeding 30%, long histories of Jim Crow legislation, and persistent structural disparities in income, education, and incarceration that trace directly to that history. Delaware is the outlier. It fought for the Union, sits on the Mid-Atlantic coast, and has a Black population of roughly 23%, yet lands in the same tier as Mississippi.
At the other end, only three states score "Much Less Than Average": Vermont, New Hampshire, and Idaho. All three are among the whitest states in the country. That is not a coincidence, and it is not entirely reassuring. The reasons it matters surface later.
Between those extremes, the bulk of the country clusters in the middle tiers. Roughly 17 states score "Above Average," 14 land at "Average," and 12 sit at "Below Average." The map this creates does not look the way most people expect.
The South Scores High, but the Midwest Is Not Far Behind
The Southern cluster is the least surprising pattern in the data. Alabama, Tennessee, and South Carolina all score "Above Average," part of a geographic arc from the Appalachian foothills to the Gulf Coast. So do Arkansas, Kentucky, and Virginia, alongside North Carolina, Texas, and Florida. These are states where legal segregation persisted into the 1960s and where disparities in school funding, criminal sentencing, and generational wealth between Black and white residents remain among the widest in the country.
What is harder to explain with a simple North-South narrative is the rest of the "Above Average" list. Illinois, Pennsylvania, and Michigan are all there, alongside Ohio, Rhode Island, Indiana, and Maryland. These are states that never had Jim Crow laws on the books. They are also states that contain some of the most racially segregated metropolitan areas in America.
Chicago and Detroit rank among the most residentially segregated cities in the country by the index of dissimilarity, a standard measure of how evenly racial groups are distributed across neighborhoods. That segregation was engineered. During the Great Migration, roughly 7 million Black Americans moved to Northern cities between the early 1900s and the 1970s, where they were met with redlining, restrictive covenants, and sometimes outright violence.
The wealth gap that exclusion created compounds over generations. A family locked out of homeownership in 1950 could not pass equity to their children in 1980, who could not help their own children with a down payment in 2010. Research from the Brookings Institution has shown that homes in formerly redlined neighborhoods are still worth less today, even after controlling for the condition of the property.
Low Scores Do Not Mean Low Prejudice
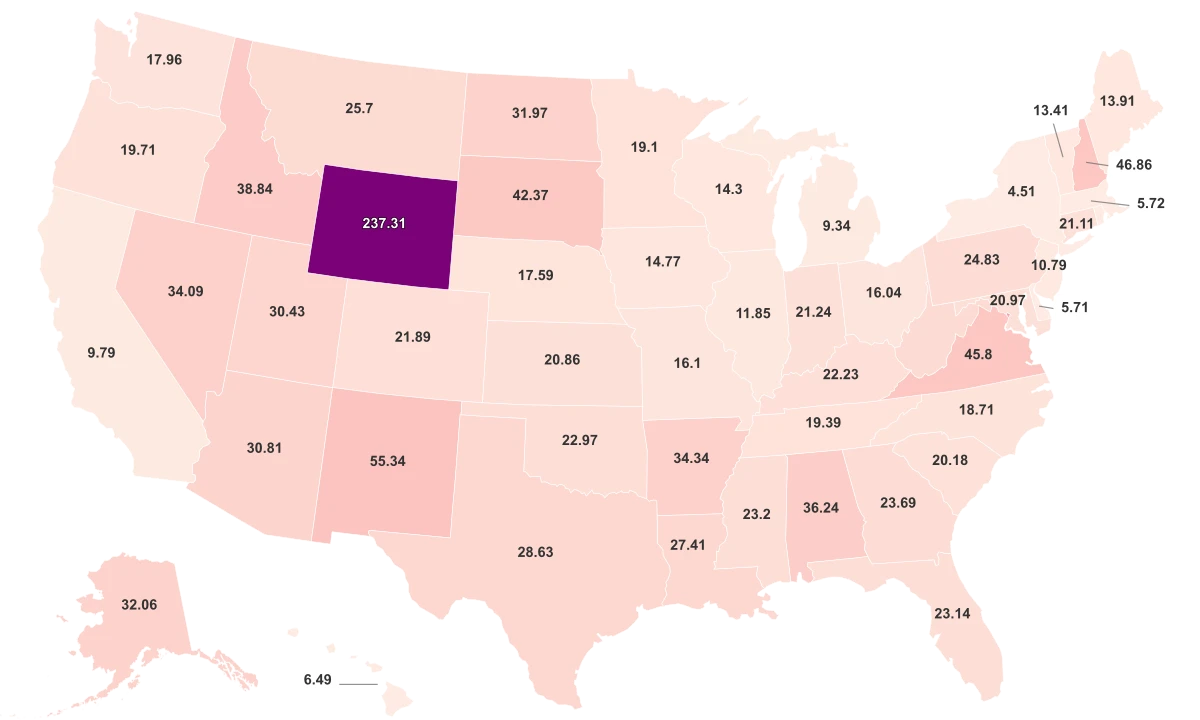
The three states at the bottom of this index, Vermont, New Hampshire, and Idaho, share one defining characteristic: their populations are overwhelmingly white. Vermont's non-Hispanic white population is roughly 93.6%. New Hampshire sits at about 89.8%. Idaho is approximately 82%. When the denominator of minority residents is that small, the numerator of measurable discriminatory incidents, disparity gaps, and reported hate crimes shrinks with it.
This is not a theory. It is arithmetic. An index that measures income gaps between Black and white households has less to work with in a state where Black residents make up 1.4% of the population than in a state where they make up 38%. A hate crime count in a county with 200 minority residents will look different from one in a county with 200,000. The low scores in these states may reflect genuine tolerance. They may also reflect the simple absence of the conditions that produce measurable friction.
Sociologist Eduardo Bonilla-Silva described this dynamic in his framework of "racism without racists," arguing that discriminatory structures and attitudes can persist even in places where explicit incidents are rare and where most residents sincerely reject racial prejudice. Oregon offers a useful case study. It scores "Below Average" on this index, yet it was founded as an explicitly white-supremacist state.
Oregon's 1857 constitution included an exclusion clause banning Black people from residing in the state. Portland had documented sundown-town practices well into the mid-20th century. The state's Black population remains under 3%, partly because of that history. A low index score does not erase that context.
The inverse is also true. Maryland scores "Above Average" despite being one of the most politically progressive states in the country. It also has a Black population of over 31% and contains Baltimore, a city where decades of housing discrimination, police misconduct, and environmental racism have produced some of the starkest racial health and wealth disparities in the nation. The index is measuring the size of the disparity, not the political orientation of the state government.
Why No Racism Index Should Be Taken at Face Value
The most important thing to understand about this ranking is what it does not tell you. The Racism Index Score used here does not cite a specific source, methodology, or data year. That is a significant limitation for a topic this sensitive. Without knowing exactly which indicators were aggregated, how they were weighted, and when the data was collected, the reader is left trusting a label without seeing the receipts.
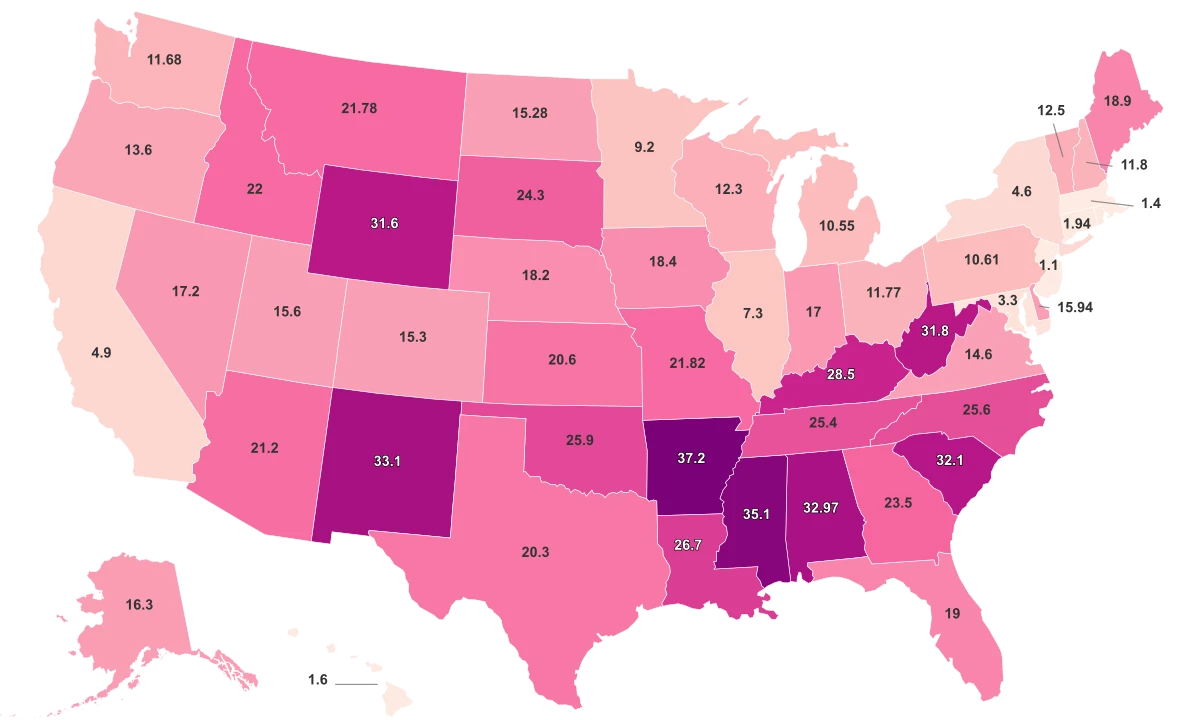
That opacity is not unique to this index. Most "racism by state" rankings available online are built from imperfect datasets, each with its own blind spots. FBI hate crime statistics, for example, rely on voluntary reporting by local law enforcement: in 2023, agencies reported 11,862 incidents nationally, but some jurisdictions report zero year after year, not because none occur, but because they lack the infrastructure or institutional will to classify them. The FBI itself advises against using the data for direct state-to-state comparisons.
Google search data, popularized by Seth Stephens-Davidowitz's research at Harvard, offers a different lens. Stephens-Davidowitz analyzed searches containing the N-word between 2004 and 2007 and found that the geographic divide ran East-West, not North-South, with West Virginia, upstate New York, and rural Pennsylvania showing some of the highest rates. That finding challenged the assumption that racism is primarily a Southern phenomenon. But the data is nearly two decades old, frozen in a pre-smartphone internet era.
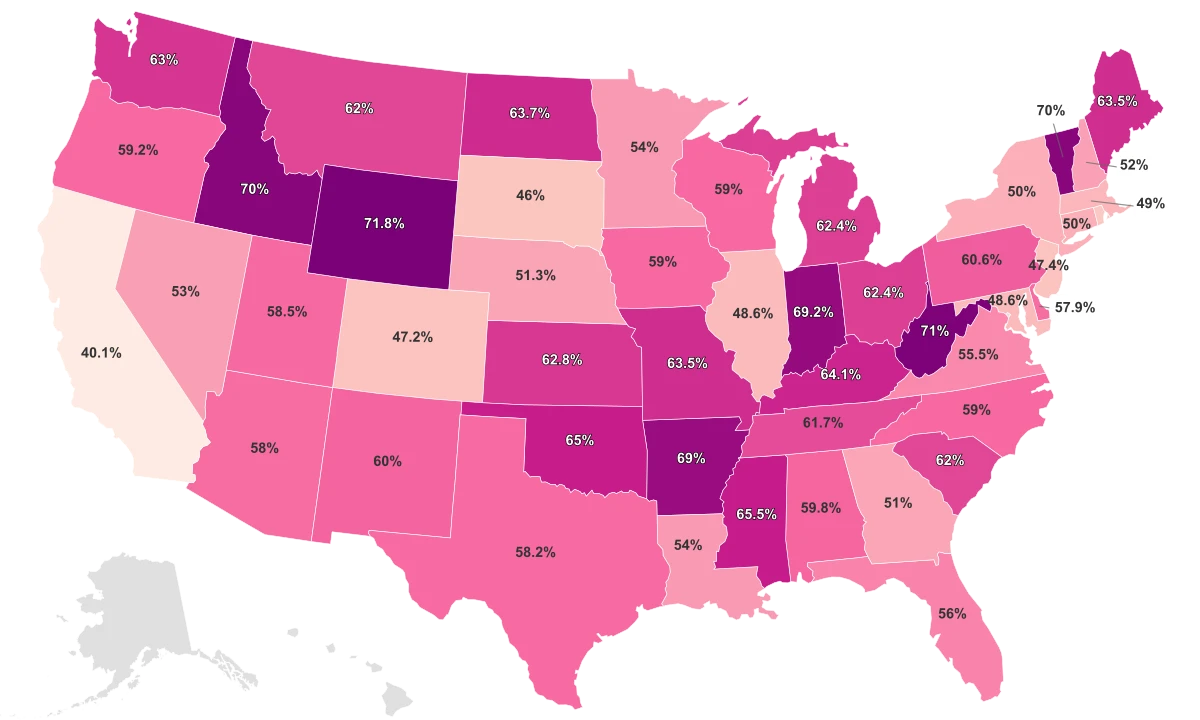
Structural racism indices from institutions like Boston University and the University of Connecticut take yet another approach, measuring outcome gaps rather than attitudes or incidents. They compare Black and white populations on income, incarceration rates, educational attainment, and health outcomes, then standardize the gaps into a composite score. These indices are methodologically transparent but they measure the consequences of racism, not racism itself. A state can score high because of policies enacted 80 years ago, even if current attitudes have shifted.
No single number captures something as layered as racial prejudice, structural inequality, and lived experience of discrimination. This ranking provides a starting point for understanding regional patterns, but the categories on the map are not verdicts. They are rough outlines drawn from imperfect data, and they should be read that way.