Least Racist States

 | Alabama | Above Average | |
 | Alaska | Average | |
 | Arizona | Average | |
 | Arkansas | Above Average | |
 | California | Average | |
 | Colorado | Below Average | |
 | Connecticut | Average | |
 | Delaware | Much More Than Average | |
 | Florida | Above Average | |
 | Georgia | Much More Than Average | |
 | Hawaii | Average | |
 | Idaho | Much Less Than Average | |
 | Illinois | Above Average | |
 | Indiana | Above Average | |
 | Iowa | Average | |
 | Kansas | Average | |
 | Kentucky | Above Average | |
 | Louisiana | Much More Than Average | |
 | Maine | Below Average | |
 | Maryland | Above Average | |
 | Massachusetts | Below Average | |
 | Michigan | Above Average | |
 | Minnesota | Below Average | |
 | Mississippi | Much More Than Average | |
 | Missouri | Average | |
 | Montana | Below Average | |
 | Nebraska | Average | |
 | Nevada | Above Average | |
 | New Hampshire | Much Less Than Average | |
 | New Jersey | Average | |
 | New Mexico | Average | |
 | New York | Average | |
 | North Carolina | Above Average | |
 | North Dakota | Below Average | |
 | Ohio | Above Average | |
 | Oklahoma | Average | |
 | Oregon | Below Average | |
 | Pennsylvania | Above Average | |
 | Rhode Island | Above Average | |
 | South Carolina | Above Average | |
 | South Dakota | Average | |
 | Tennessee | Above Average | |
 | Texas | Above Average | |
 | Utah | Below Average | |
 | Vermont | Much Less Than Average | |
 | Virginia | Above Average | |
 | Washington | Below Average | |
 | West Virginia | Average | |
 | Wisconsin | Average | |
 | Wyoming | Below Average |
Last updated June 24, 2026
Key Takeaways
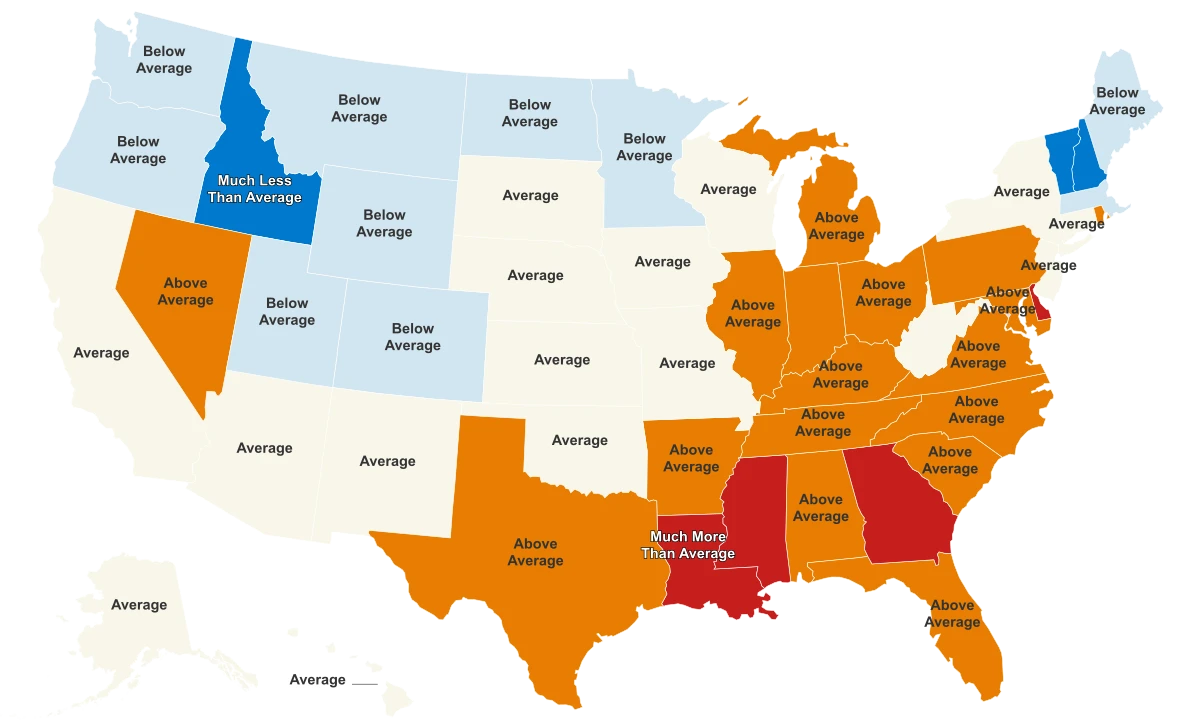
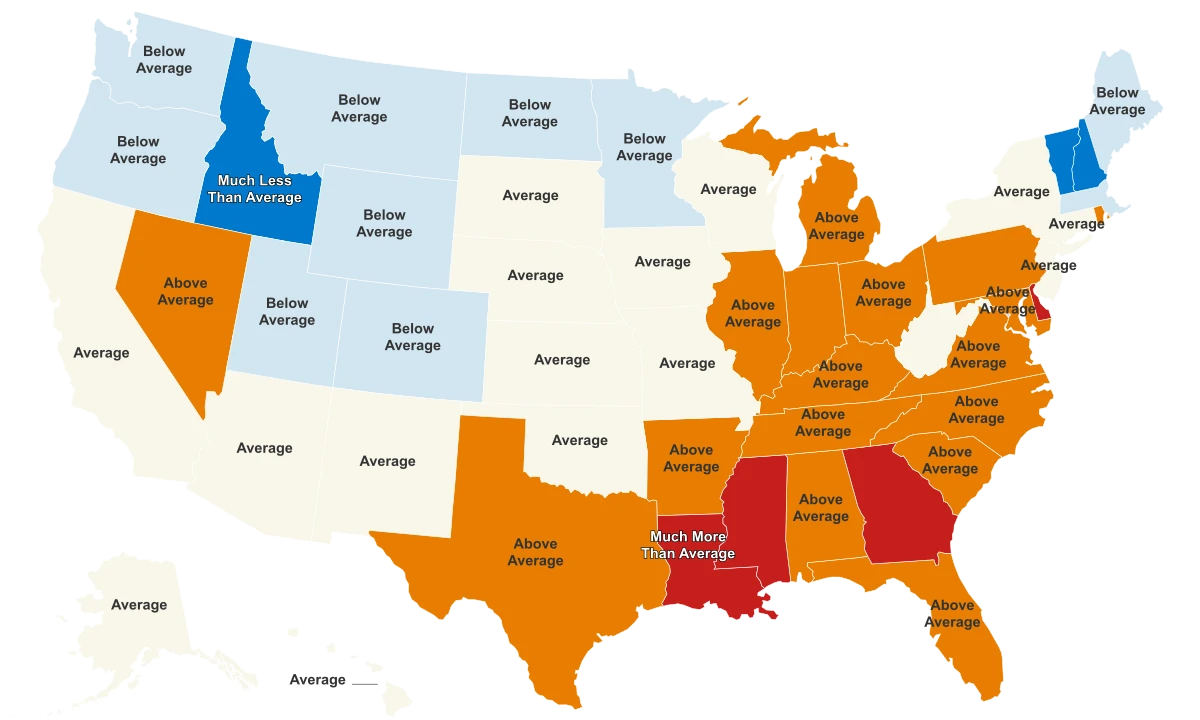
- Only three states land in the lowest prejudice band, "Much Less Than Average": Vermont, New Hampshire, and Idaho.
- Four states sit in the highest band, "Much More Than Average": Delaware, Mississippi, Louisiana, and Georgia.
- Most of the country is graded ordinary: 33 of the 50 states fall in the two middle bands, so the "least" and "most" labels describe only a handful at each edge.
- The score measures racial equality gaps, not attitudes, so a better band means outcomes for Black and white residents are closer, not that prejudice is gone.
Three States Sit in the Lowest Band, and the Label Is Doing a Lot of Work
Start with the answer the title asks for, and read it carefully. The states that anchor the "least racist" end of this ranking are the three in the lowest band, "Much Less Than Average": Vermont, New Hampshire, and Idaho. At the other edge, four states fall in the highest band, "Much More Than Average": Delaware, Mississippi, Louisiana, and Georgia. The score does not rank states by a number. It sorts all 50 into five ordered bands.
A word on direction, because it is easy to get backwards. A higher band means more measured racial disparity, which pushes a state lower on a "least racist" list. So the lowest band is the "best" position here, and the highest band is the "worst." None of this is a judgment on the people who live in those states. It is the output of an index, and the index measures something narrower than the label suggests.
It is also worth knowing what does not ship with these bands. The data carries no publication year and no named source. The methodology behind rankings of this kind traces to WalletHub, which scores states on measurable racial equality gaps rather than on opinion. Treat the bands as one aggregator's construct, not as an audited federal statistic.
The shape of the data is a fat middle with thin edges. Most states sit in the two central bands, graded ordinary, and only a small group breaks toward either extreme. That is the quiet headline: for the large majority of the country, this index says "about average," and the dramatic-sounding labels apply to the few states at the tails.
The Index Measures Gaps, Not Attitudes
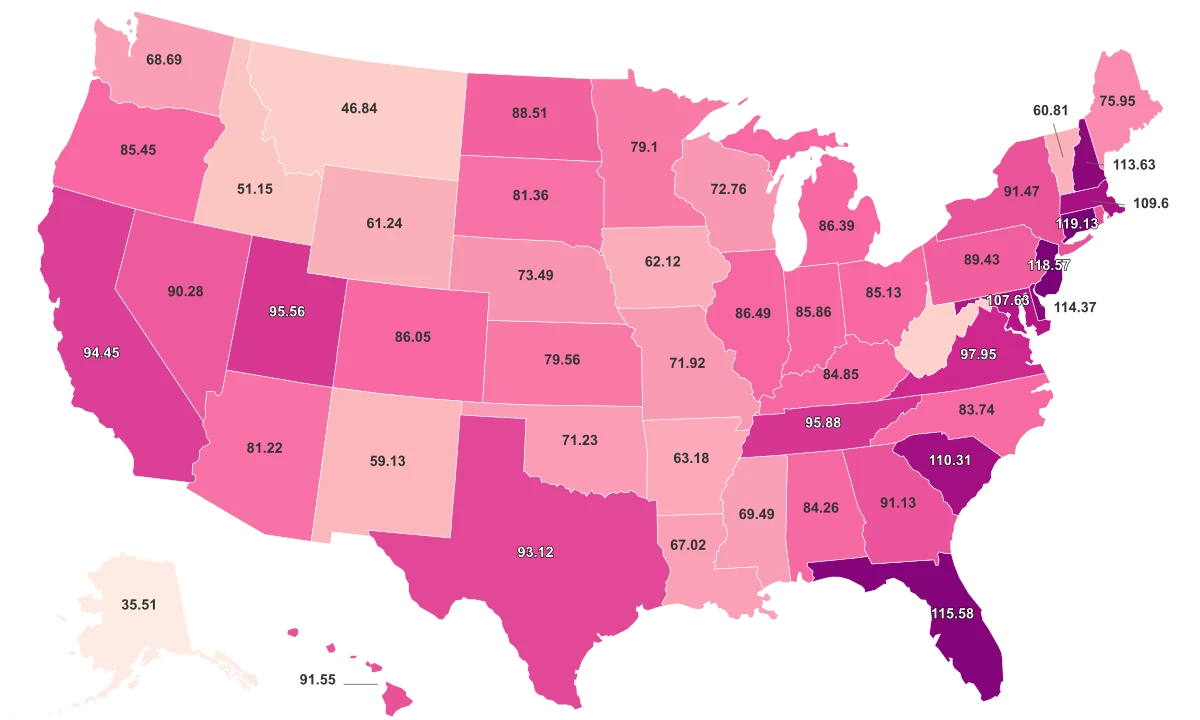
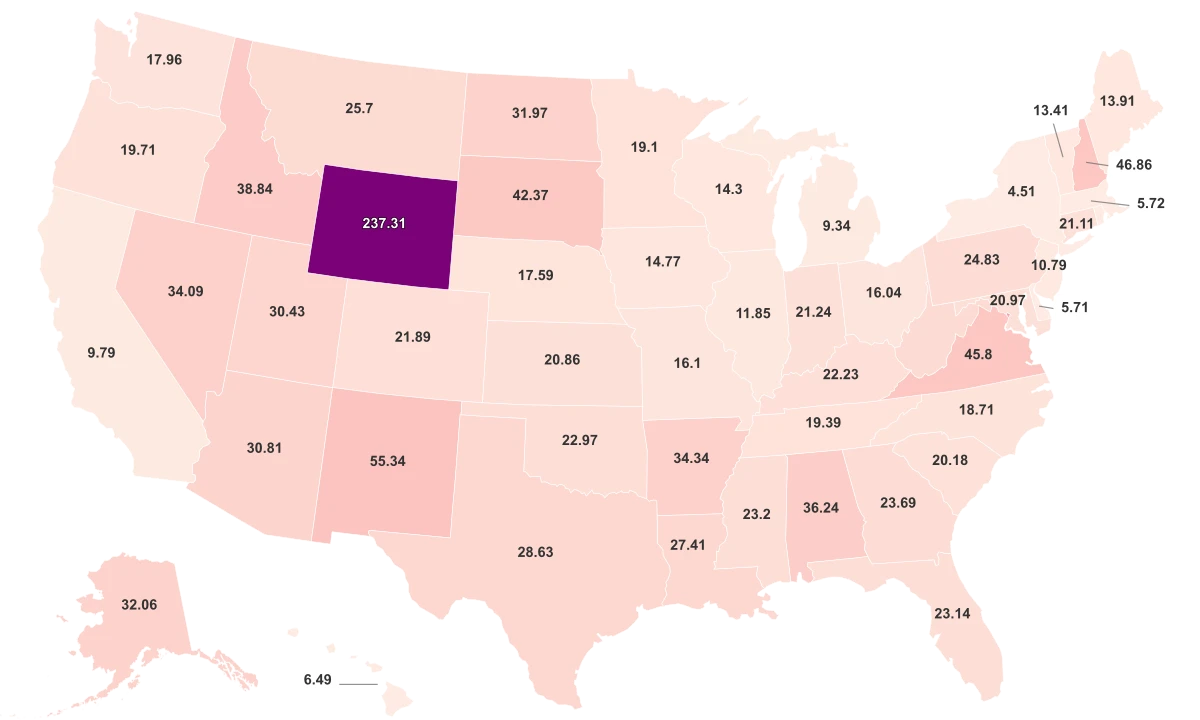
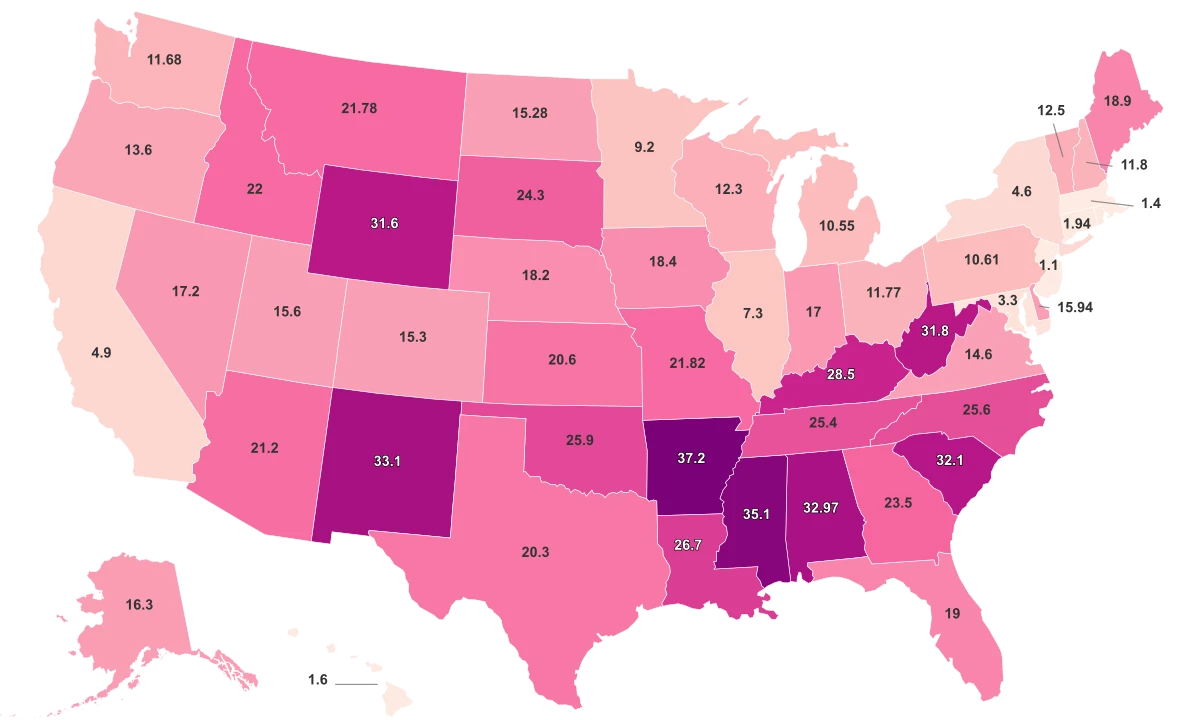
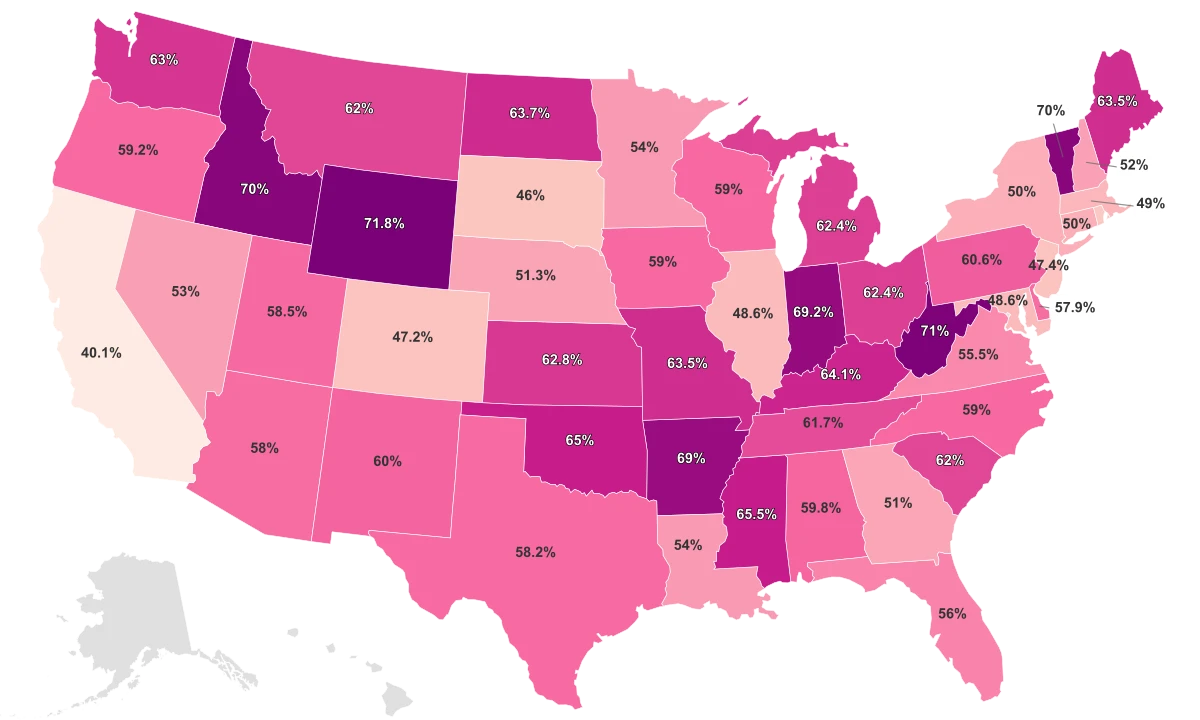
The word "racist" in the title implies a measure of how people feel. The number underneath measures something you can count instead. In the World Population Review version of this ranking, the data is drawn from WalletHub and tracks gaps between Black and white residents across roughly 21 indicators of equality and integration. Those indicators fall into four buckets: employment and wealth, education, civic engagement, and health.
That distinction changes how the bands should be read. A state earns a lower, "better" band when outcomes for Black and white residents sit closer together, not when prejudice has been measured and found absent. A higher, "worse" band reflects wider structural gaps in income, schooling, voting, and health, the kind of gaps that accumulate over decades and that no single resident chose. The index captures the footprint of those disparities, not the contents of anyone's mind.
This is why an honest reading matters more here than on most ranking pages. Academic measures in this family, such as the Racism Index built for the U.S. Sustainable Development Report, are constructed the same way, from residential segregation and gaps in incarceration, schooling, and jobs. A composite like this can tell you where racial outcomes diverge most sharply, but it cannot tell you which state's residents are more or less prejudiced. Reading the bands as a moral scoreboard is the single most common way this kind of data gets misused.
Why the Ranking Defies the Map in Your Head
Most people carry a mental map of where racism lives in America, and disparity-based measures tend to scramble it. When researchers operationalize structural racism as measurable inequity rather than attitude, the geography often flips. A peer-reviewed structural-racism index defines the concept as systemic discrimination running through "mutually reinforcing systems," measured through outcomes "rather than individual attitudes," and finds the highest values concentrated in the Midwest and Northeast, with the lowest in the Southeast.
This ranking shows the same refusal to draw a clean regional line. Three Deep South states cluster in the highest band, which fits the familiar story. But Delaware, a small Mid-Atlantic state, sits in that same top band, while Southern and Western states scatter across the middle and lower tiers rather than sinking together. The index does not reward or punish a region as a block.
Part of what drives the tails is arithmetic, not character. A gap measure depends on a state's racial composition and on how many residents fall into each group. In states with very small or highly homogeneous Black populations, the gap is calculated on thin numbers, and the composite can swing toward an extreme band without that band describing daily life for the people there. The edges of this ranking are where the methodology is most fragile, which is exactly where the label "least racist" deserves the most caution.