Dumbest Countries


1 | Somalia | 83.84 | |
2 | Timor Leste | 86.7 | |
3 | Rwanda | 86.9 | |
4 | Nicaragua | 87.75 | |
5 | Angola | 87.89 | |
6 | Gabon | 88.35 | |
7 | Uganda | 88.49 | |
8 | DR Congo | 88.6 | |
9 | Afghanistan | 89.31 | |
10 | Tanzania | 89.57 | |
11 | Botswana | 89.72 | |
12 | Indonesia | 89.96 | |
13 | El Salvador | 90 | |
14 | Dominican Republic | 90.11 | |
15 | Namibia | 90.29 | |
16 | Mozambique | 90.33 | |
17 | Ivory Coast | 90.37 | |
18 | Honduras | 90.41 | |
19 | Cameroon | 90.59 | |
20 | Guatemala | 91.35 | |
21 | Ghana | 91.46 | |
22 | Zimbabwe | 91.64 | |
23 | Panama | 91.65 | |
24 | Kenya | 91.69 | |
25 | Benin | 91.96 | |
26 | Jamaica | 92 | |
27 | Oman | 92.18 | |
28 | Senegal | 92.26 | |
29 | Paraguay | 92.38 | |
30 | Venezuela | 92.61 | |
31 | Nigeria | 92.76 | |
32 | Palestine | 92.94 | |
33 | Laos | 92.97 | |
34 | Puerto Rico | 93.01 | |
35 | Zambia | 93.05 | |
36 | Cambodia | 93.12 | |
37 | Kuwait | 93.13 | |
38 | Reunion | 93.25 | |
39 | Tajikistan | 93.39 | |
40 | Yemen | 93.43 | |
41 | Iraq | 93.62 | |
42 | South Africa | 93.63 | |
43 | Mexico | 93.64 | |
44 | Costa Rica | 93.88 | |
45 | Saudi Arabia | 94.07 | |
46 | Bahrain | 94.25 | |
47 | Kyrgyzstan | 94.48 | |
48 | Colombia | 94.62 | |
49 | Mauritius | 94.66 | |
50 | Libya | 94.76 | |
51 | Trinidad and Tobago | 94.81 | |
52 | Madagascar | 95.07 | |
53 | Brazil | 95.44 | |
54 | Ecuador | 95.45 | |
55 | Bolivia | 95.56 | |
56 | Ukraine | 95.66 | |
57 | Philippines | 95.68 | |
58 | Maldives | 95.71 | |
59 | Jordan | 95.73 | |
60 | Kazakhstan | 95.92 | |
61 | Ethiopia | 96 | |
62 | Uruguay | 96.09 | |
63 | Chile | 96.34 | |
64 | Cuba | 96.42 | |
65 | Uzbekistan | 96.51 | |
66 | Brunei | 96.54 | |
66 | Bulgaria | 96.54 | |
68 | Egypt | 96.74 | |
69 | Moldova | 96.85 | |
70 | Pakistan | 96.93 | |
71 | Turkey | 97 | |
72 | Argentina | 97.11 | |
73 | Bosnia and Herzegovina | 97.13 | |
74 | Morocco | 97.24 | |
75 | Iceland | 97.25 | |
76 | Nepal | 97.31 | |
77 | Bangladesh | 97.32 | |
78 | United Arab Emirates | 97.39 | |
79 | Tunisia | 97.46 | |
80 | Algeria | 97.53 | |
81 | Denmark | 97.68 | |
82 | Kosovo | 97.94 | |
82 | Qatar | 97.94 | |
84 | Azerbaijan | 98.03 | |
85 | Sweden | 98.22 | |
85 | Ireland | 98.22 | |
87 | Myanmar | 98.28 | |
88 | Norway | 98.31 | |
89 | Syria | 98.41 | |
90 | Montenegro | 98.43 | |
91 | India | 98.44 | |
92 | Malaysia | 98.51 | |
93 | Israel | 98.57 | |
94 | Luxembourg | 98.75 | |
95 | Slovakia | 98.87 | |
96 | Romania | 98.88 | |
96 | North Macedonia | 98.88 | |
98 | Latvia | 99.01 | |
99 | Estonia | 99.08 | |
100 | Lebanon | 99.13 | |
101 | Poland | 99.14 | |
102 | Croatia | 99.32 | |
102 | Germany | 99.32 | |
104 | Czech Republic | 99.36 | |
105 | Greece | 99.55 | |
106 | Malta | 99.68 | |
107 | Belgium | 99.74 | |
108 | Serbia | 99.83 | |
109 | Austria | 99.85 | |
110 | Thailand | 99.94 | |
111 | Portugal | 99.95 | |
111 | Lithuania | 99.95 | |
113 | Finland | 99.97 | |
114 | France | 100.12 | |
115 | Armenia | 100.13 | |
116 | Hungary | 100.15 | |
117 | Peru | 100.22 | |
118 | Netherlands | 100.27 | |
119 | Italy | 100.33 | |
120 | Georgia | 100.35 | |
121 | Switzerland | 100.84 | |
122 | Albania | 101 | |
123 | United States | 101.04 | |
124 | Belarus | 101.05 | |
125 | Slovenia | 101.15 | |
126 | Sri Lanka | 101.22 | |
127 | United Kingdom | 101.57 | |
128 | Canada | 102.09 | |
129 | Cyprus | 102.12 | |
130 | Spain | 102.24 | |
131 | Vietnam | 102.26 | |
132 | New Zealand | 102.35 | |
133 | Mongolia | 102.61 | |
134 | Singapore | 103.56 | |
135 | Russia | 103.78 | |
136 | Australia | 104.45 | |
137 | Iran | 104.8 | |
138 | Taiwan | 105.84 | |
139 | Macau | 106.32 | |
140 | Japan | 106.35 | |
141 | China | 106.48 | |
142 | South Korea | 106.97 | |
143 | Hong Kong | 107.73 |
Last updated March 28, 2026
These Rankings Measure Opportunity, Not Intelligence
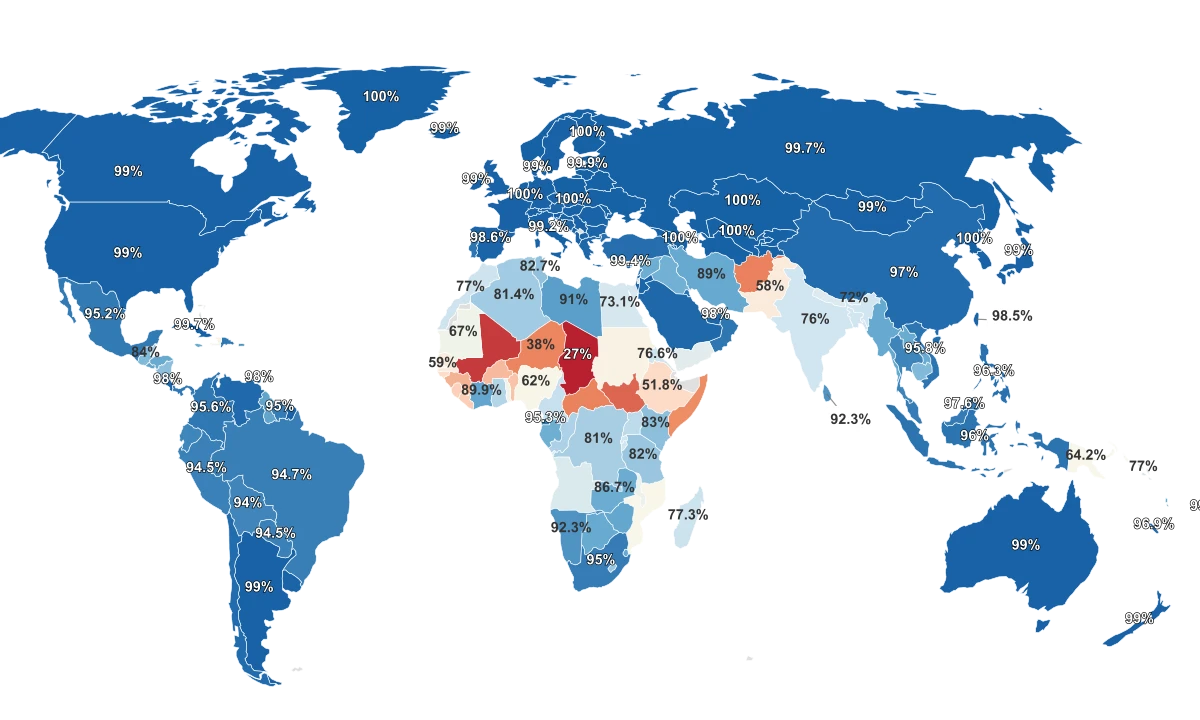
Before looking at the data, one thing needs to be clear: no ranking of "dumbest countries" actually measures how smart a country's people are. What these metrics measure is the combined effect of school funding, childhood nutrition, political stability, and access to testing. A child born in Chad, where only 27% of adults can read, is not less capable than a child born in Finland. That child is growing up in a country with fewer schools, fewer teachers, and fewer meals.
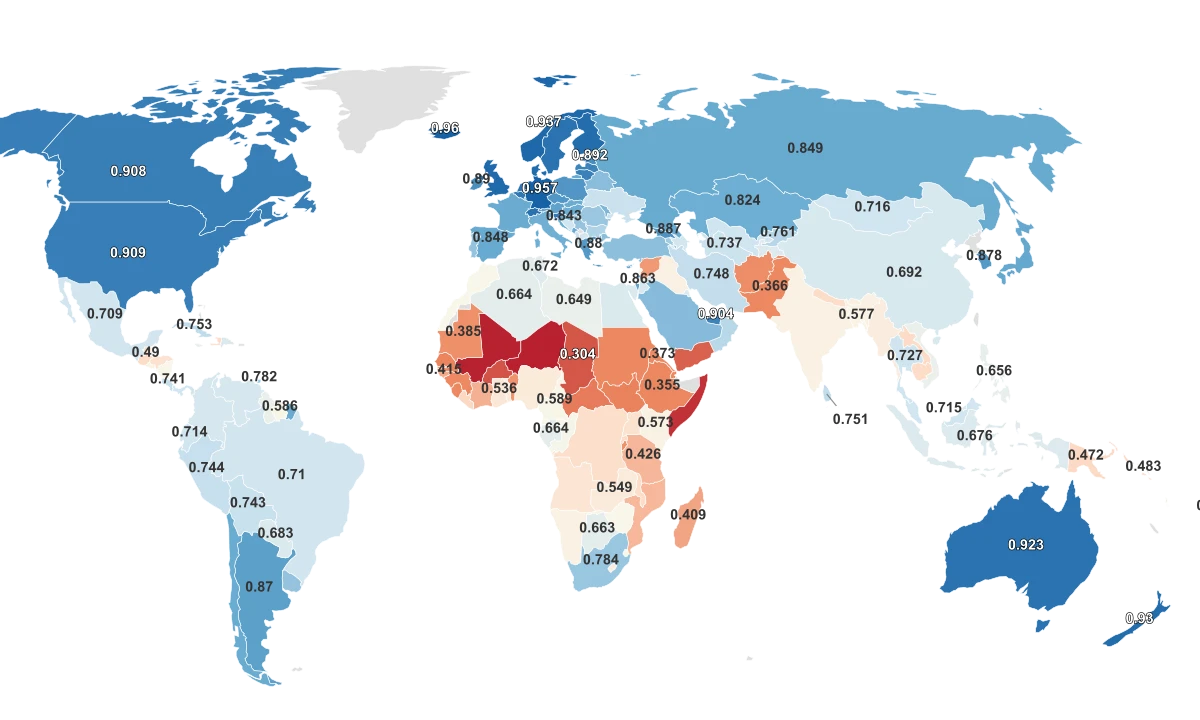
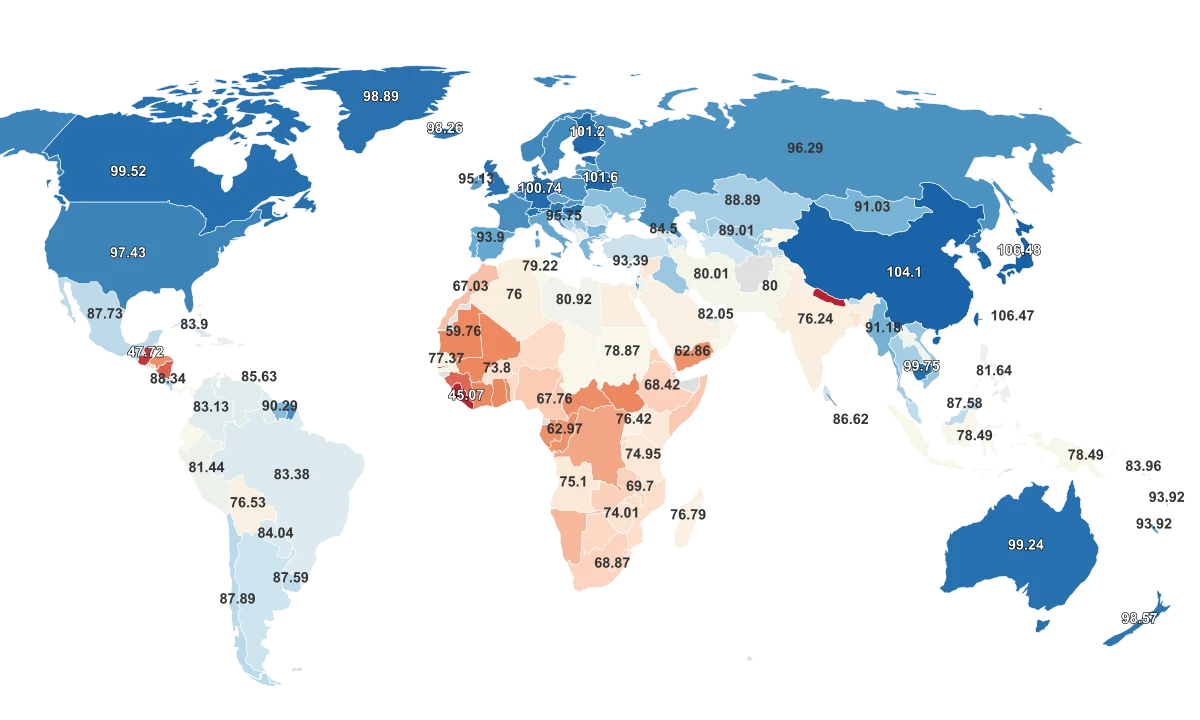
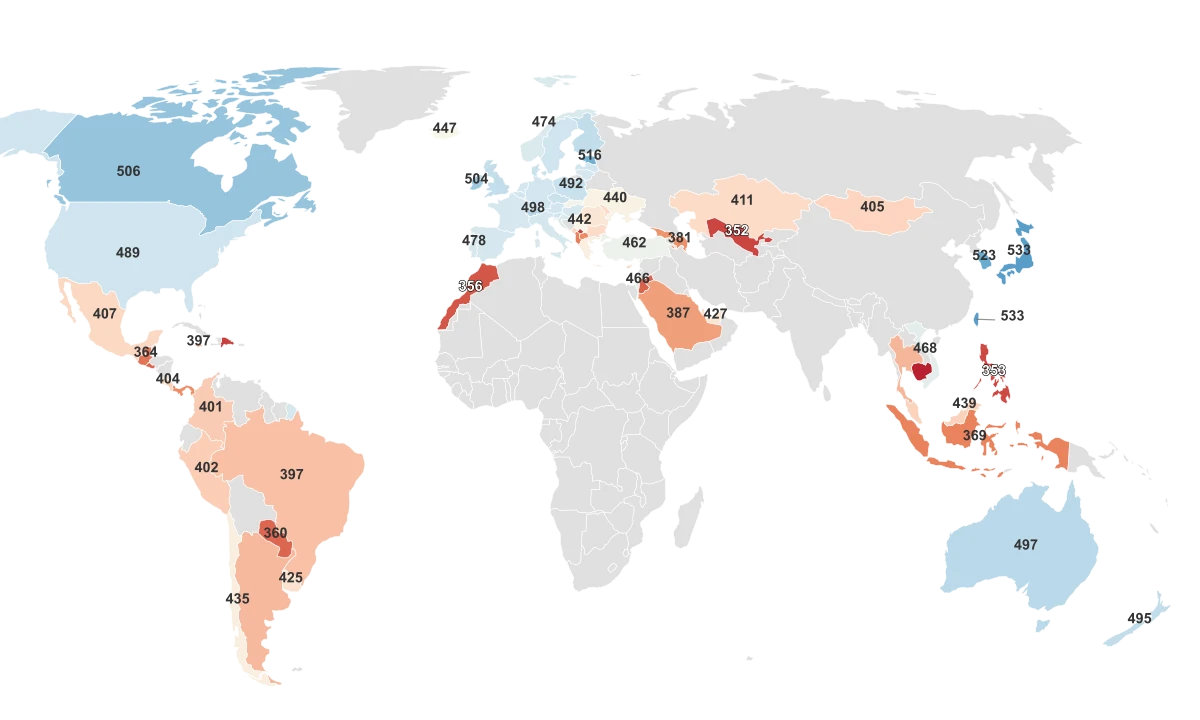
This ranking draws on four distinct metrics. Average IQ comes from the International IQ Test, an online assessment covering 143 countries. The Education Index, from the UNDP Human Development Report, measures years of schooling across 193 countries. Overall PISA scores come from the OECD's 2022 assessment of 15-year-olds in 81 participating countries. And the Total Literacy Rate, from the World Bank, covers 201.
The gap between top and bottom is enormous. Fourteen countries report 100% adult literacy. Chad sits at 27%. On PISA, Singapore scores 560 and Cambodia scores 337, a gap the OECD equates to roughly seven years of schooling. The countries at the bottom are not scattered randomly across the globe. They cluster in one region.
All Metrics
The Same Countries Appear at the Bottom of Every List
Niger, Chad, Mali, Burkina Faso, and Somalia appear as statistical outliers on the Education Index, all scoring below 0.310, more than two standard deviations below the global mean. The same five countries anchor the bottom of the literacy ranking. On average IQ, Somalia scores 83.84, the lowest in the dataset by a wide margin.
These are not random countries that happen to share low scores. All five sit within or adjacent to the Sahel, the semi-arid belt stretching across Africa south of the Sahara. All five have experienced prolonged armed conflict. And all five have childhood malnutrition rates among the highest in the world, which matters more than it might seem: the WHO classifies iodine deficiency as the leading cause of preventable mental impairment in childhood, and roughly 60 million children under five in Sub-Saharan Africa are not growing properly.
Niger illustrates the full architecture of the problem. It has the world's highest child marriage rate, according to UNICEF. French is the language of instruction, but most children speak Hausa at home. Terrorist conflicts along the borders have closed schools in entire regions. Girls who do attend face unsafe travel distances and a near-total absence of female teachers. The result is a literacy rate of 38% and an Education Index of 0.243, the lowest on the planet.
Money alone does not fix this. What matters is how it is spent. Vietnam scored 468 on the 2022 PISA assessment, nearly matching the OECD average, on cumulative per-student spending of approximately $13,800. Qatar scored 422 and the United Arab Emirates scored 427, despite spending many times more. A World Bank analysis attributed Vietnam's results to teacher quality, low absenteeism, and universal primary enrollment achieved decades ago.
These gaps are not permanent. A study in rural Kenya documented an 11-point increase in measured IQ over just 14 years, driven by improved nutrition and expanded schooling. The scores at the bottom of this ranking are a snapshot of where investment in children has been lowest for the longest.
The IQ Numbers Come From an Online Test, and It Shows
The IQ data in this ranking does not come from clinical assessments administered by researchers in each country. It comes from international-iq-test.com, a commercial online test inspired by Raven's Progressive Matrices. The platform claims a database of over 16 million results. But taking the test requires internet access, a web browser, and a payment, which means the sample is self-selected and skewed toward populations with reliable connectivity and disposable income.
That bias shows up in the data. Iran scores 104.8, the 7th-highest IQ in the dataset, above Singapore, Canada, and the United States. But Iran does not participate in PISA and scores only 0.748 on the Education Index. Sri Lanka tells a similar story: 101.22 on IQ, just 0.751 on educational attainment. In both cases, the people taking an English-language online test are likely a narrow, unusually well-educated slice of the population.
The correlation between IQ and the Education Index is 0.658. That is strong, but far from the near-perfect alignment you would expect if both metrics were measuring the same thing. The correlation between IQ and literacy is even weaker at 0.526. By contrast, the Education Index and literacy track each other at 0.835. The IQ metric is not useless, but it is the weakest link in this ranking, and readers should weight it accordingly.
IQ Scores and Educational Attainment Tell Different Stories
Countries like Iran and Sri Lanka score high on the online IQ test but much lower on the UNDP Education Index, suggesting the IQ data reflects test access more than national cognitive ability.
Sources & Notes
Measures average human intelligence based on standardized tests where 100 is the standard average.
Measure of years of schooling and educational attainment levels achieved by the population.
Average score across reading, mathematics, and science assessments for 15-year-old students.
% of the total adult population (ages 15 and above) who can both read and write short, simple statements in their everyday life.