Least Educated States


1 | West Virginia | 24.29 | |
2 | Louisiana | 28.64 | |
3 | Arkansas | 30.25 | |
4 | Oklahoma | 32.55 | |
5 | Nevada | 34.6 | |
6 | Kentucky | 35.76 | |
7 | Alabama | 36.48 | |
8 | New Mexico | 37.81 | |
9 | Texas | 40.22 | |
10 | Indiana | 42.98 | |
11 | Tennessee | 43.23 | |
12 | Idaho | 44.55 | |
13 | Arizona | 45.89 | |
14 | Alaska | 47.31 | |
15 | South Dakota | 47.49 | |
15 | South Carolina | 47.49 | |
17 | Ohio | 47.61 | |
18 | Missouri | 47.71 | |
19 | Iowa | 48.24 | |
20 | Georgia | 48.81 | |
21 | California | 49.45 | |
22 | Wyoming | 49.94 | |
23 | Michigan | 50.59 | |
24 | North Dakota | 50.94 | |
25 | Kansas | 50.98 | |
26 | North Carolina | 51.85 | |
27 | Nebraska | 52.15 | |
28 | Pennsylvania | 53.26 | |
29 | Wisconsin | 53.69 | |
30 | Florida | 53.76 | |
31 | Montana | 54.49 | |
32 | Hawaii | 55.61 | |
33 | Maine | 56.31 | |
34 | Oregon | 56.94 | |
35 | New York | 57.16 | |
36 | Delaware | 58.23 | |
37 | Rhode Island | 58.7 | |
38 | Illinois | 59.18 | |
39 | Utah | 60.77 | |
40 | Minnesota | 64.43 | |
41 | Washington | 65.69 | |
42 | New Hampshire | 66.89 | |
43 | New Jersey | 67.96 | |
44 | Virginia | 68.05 | |
45 | Connecticut | 70.41 | |
46 | Colorado | 70.71 | |
47 | Vermont | 73.54 | |
48 | Maryland | 75.13 | |
49 | Massachusetts | 82.28 |
Last updated February 28, 2026
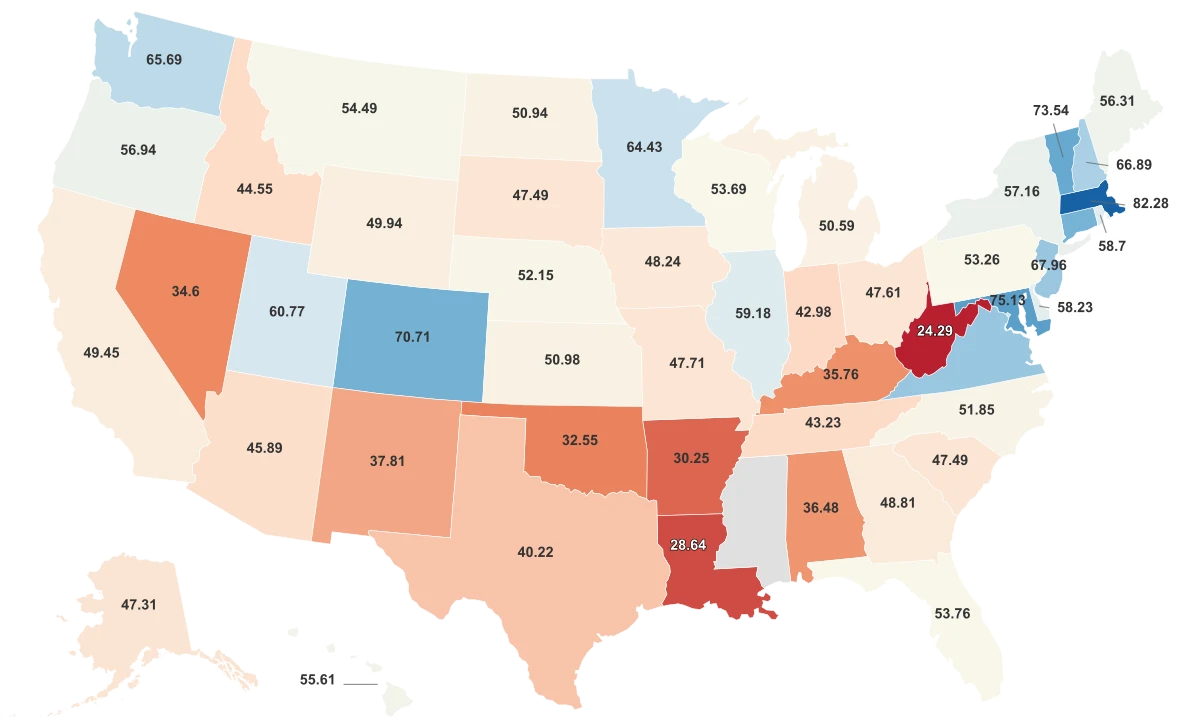
Low Educational Attainment Across U.S. States
Education is one of the foremost predictors of economic opportunity, health outcomes, and civic participation. Yet, even as attainment has risen nationwide, stark disparities remain across U.S. states. According to Education Data Initiative, approximately 91.4% of Americans aged 25 and older hold at least a high school diploma, while about 38.3% have earned a bachelor’s degree or more.
This page focuses on the states with the relatively lowest educational attainment levels — those where fewer adults achieve higher degrees, and where the gap from national averages is most pronounced.
Sources for this data data from the U.S. Census Bureau’s American Community Survey (ACS), which tracks educational attainment trends over time, along with comparative metrics from WalletHub’s 2025 Most & Least Educated States report, which evaluates 18 indicators spanning attainment, school quality, and achievement gaps.
The analysis below is designed not to shame but to illuminate — to show where policy, investment, geography, and historical inequality intersect with educational outcomes.
All Metrics
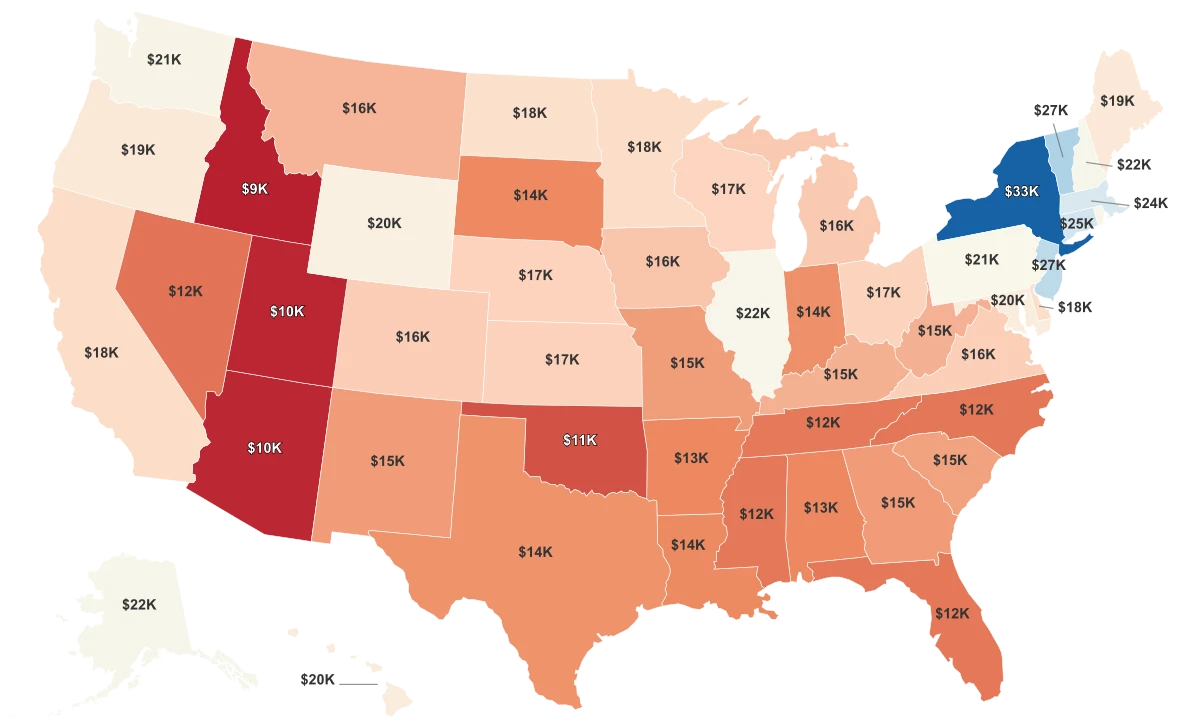
| Region ↕ | Education Score 2025↕ | High School Completion Rate↕ | Average IQ 2006↕ | K-12 Spending 2025↕ |
|---|---|---|---|---|
| Massachusetts | 82.3 | |||
| Maryland | 75.1 | |||
| Vermont | 73.5 | |||
| Colorado | 70.7 | |||
| Connecticut | 70.4 | |||
| Virginia | 68 | |||
| New Jersey | 68 | |||
| New Hampshire | 66.9 | |||
| Washington | 65.7 | |||
| Minnesota | 64.4 | |||
| Utah | 60.8 | |||
| Illinois | 59.2 | |||
| Rhode Island | ||||
| Delaware | 58.2 | |||
| New York | 57.2 | |||
| Oregon | 56.9 | |||
| Maine | 56.3 | |||
| Hawaii | 55.6 | |||
| Montana | 54.5 | |||
| Florida | 53.8 | |||
| Wisconsin | 53.7 | |||
| Pennsylvania | 53.3 | |||
| Nebraska | 52.1 | |||
| North Carolina | 51.9 | |||
| Kansas | 51 | |||
| North Dakota | 50.9 | |||
| Michigan | 50.6 | |||
| Wyoming | 49.9 | |||
| California | 49.5 | |||
| Georgia | 48.8 | |||
| Iowa | 48.2 | |||
| Missouri | 47.7 | |||
| Ohio | 47.6 | |||
| South Dakota | 47.5 | |||
| South Carolina | 47.5 | |||
| Alaska | 47.3 | |||
| Arizona | 45.9 | |||
| Idaho | 44.5 | |||
| Tennessee | 43.2 | |||
| Indiana | 43 | |||
| Texas | 40.2 | |||
| New Mexico | 37.8 | |||
| Alabama | 36.5 | |||
| Kentucky | 35.8 | |||
| Nevada | ||||
| Oklahoma | 32.5 | |||
| Arkansas | 30.3 | |||
| Louisiana | 28.6 | |||
| West Virginia | 24.3 |
Key Findings
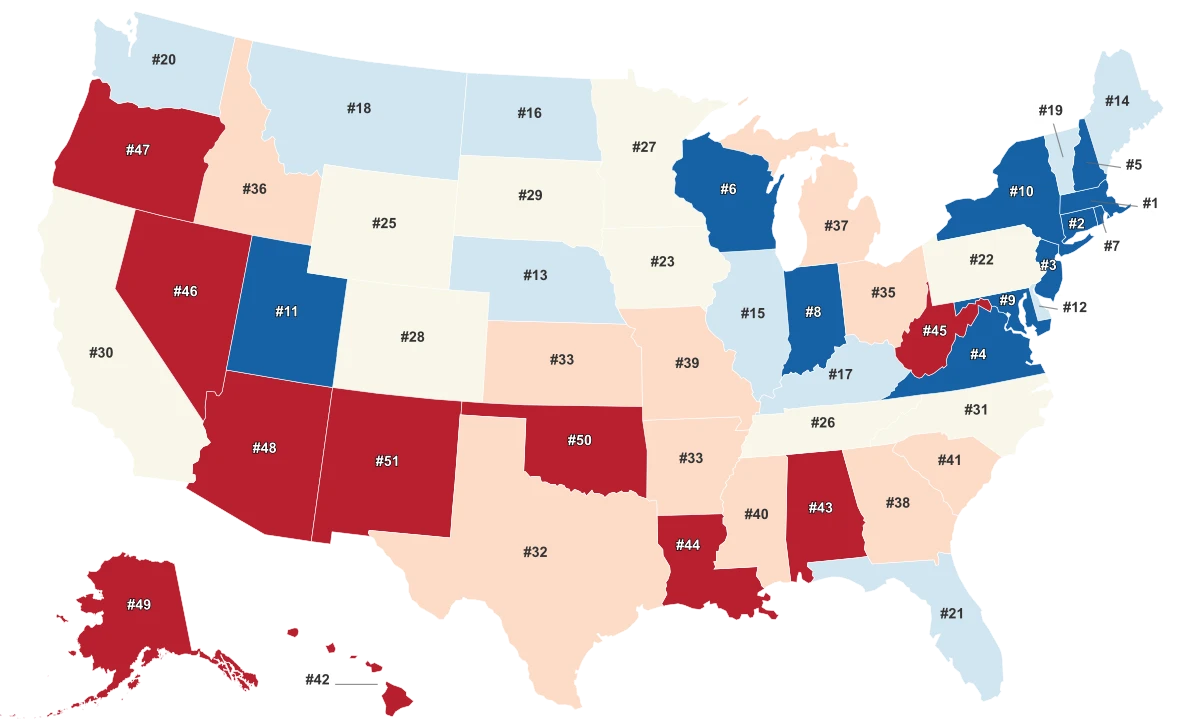
- West Virginia ranks last overall with the lowest composite score and degree attainment rates in the dataset. Only about one in four adults holds a college degree, confirming its position as the least educated state in the nation.
- Mississippi and Louisiana follow, both recording low high-school completion and college graduation rates. Their overall scores remain within a few points of West Virginia, showing a narrow margin among the three least-performing states.
- Arkansas, Alabama, and Kentucky round out the lower tier, with slightly higher completion rates but similarly weak bachelor’s and associate’s degree shares. These states remain far below the national benchmark, where about 38 % of adults hold a bachelor’s degree or higher.
- Regional concentration is clear: eight of the ten least-educated states are located in the South or lower Appalachian region, where slower economic diversification and rural population density align closely with lower education levels.
- The score gap between the top and bottom states exceeds 50 %. That disparity indicates that despite national improvement in graduation rates, a small group of states continues to account for most of the national shortfall in higher education attainment.
10 States with the Lowest Levels of Education
- West Virginia is the least educated state in the U.S. in 2025, with an education score of 24.3 and only 24.4% of adults holding a bachelor’s degree or higher. The high school completion rate (87.6%) remains below the national average. A long-term reliance on coal mining and manufacturing, combined with rural isolation and population decline, limits access to universities and job opportunities requiring higher education. Poverty affects nearly 17% of residents, reinforcing the state’s low college attainment.
- Louisiana ranks second-lowest in education attainment, scoring 28.6 with 27.8% of adults earning a bachelor’s degree or higher and a high school completion rate of 85.9%. The state faces persistent economic inequality and the long-term effects of infrastructure loss after Hurricane Katrina. High child poverty (27.8%) and limited access to quality higher education institutions continue to hinder improvement in college graduation rates.
- Arkansas has the 3rd lowest education score of 30.3, 87.2% high school completion, and 27.1% of adults holding bachelor’s degrees or higher. Rural poverty—especially in the Arkansas Delta—combined with limited university access and underfunded school systems, restricts academic progress. Fourteen counties remain in “persistent poverty,” where intergenerational barriers to higher education are strongest.
- Oklahoma’s education score of 32.5 and 29.3% bachelor’s attainment place it near the national bottom. The high school completion rate (88.6%) is respectable, but underfunding, low teacher pay, and limited investment in higher education drive weak college outcomes. About 16% of residents live in poverty, and rural communities still struggle to retain qualified teachers and expand access to postsecondary programs.
- Nevada posts an education score of 34.6, 86.9% high school completion, and 28.5% of adults with a bachelor’s degree or higher. Despite strong job growth, much of the state’s economy relies on hospitality and service industries that do not require college degrees. Rapid population changes, overcrowded schools in Clark County, and rural education gaps make it one of the lowest-educated states in the West.
- Kentucky records an education score of 35.8, with 87.2% high school completion and 27.9% of adults holding bachelor’s degrees or higher. While the state performs moderately in K-12, higher education attainment remains low, especially in Appalachian counties. Economic transitions away from coal and limited access to four-year institutions continue to slow improvement in college graduation rates.
- Alabama’s education score of 36.5 reflects its struggle to raise higher education outcomes. The state’s high school completion rate is 86.9%, and only 29.9% of adults have a bachelor’s degree or higher. While urban centers like Huntsville and Birmingham perform better, rural and Black Belt counties lag due to underfunded schools and limited college access. Poverty (≈16%) remains a major barrier to attainment.
- New Mexico has an education score of 37.8, a high school completion rate of 86.5%, and roughly 29% of adults with bachelor’s degrees or higher. Its large rural and tribal regions face geographic isolation and funding challenges that limit postsecondary access. The state also has one of the highest child poverty rates (≈25%), contributing to persistent gaps in college enrollment and degree completion.
- Texas, with an education score of 40.2, shows one of the widest internal disparities in the U.S. While 35.2% of adults hold a bachelor’s degree or higher, the high school completion rate (84.4%) is the lowest among this group. Major urban centers like Austin and Dallas perform above average, but rural and border counties remain far behind, reflecting the uneven reach of higher education across a rapidly growing population.
- Indiana stands at the top of this lower tier with an education score of 43.0, 89.3% high school completion, and 30.7% bachelor’s attainment. The state’s industrial legacy reduced reliance on higher education, and while K-12 outcomes are stable, college continuation rates remain low in rural and post-industrial areas. New workforce and community-college programs aim to raise degree attainment but progress is gradual.
Sources & Notes
Overall educational performance score based on multiple factors.
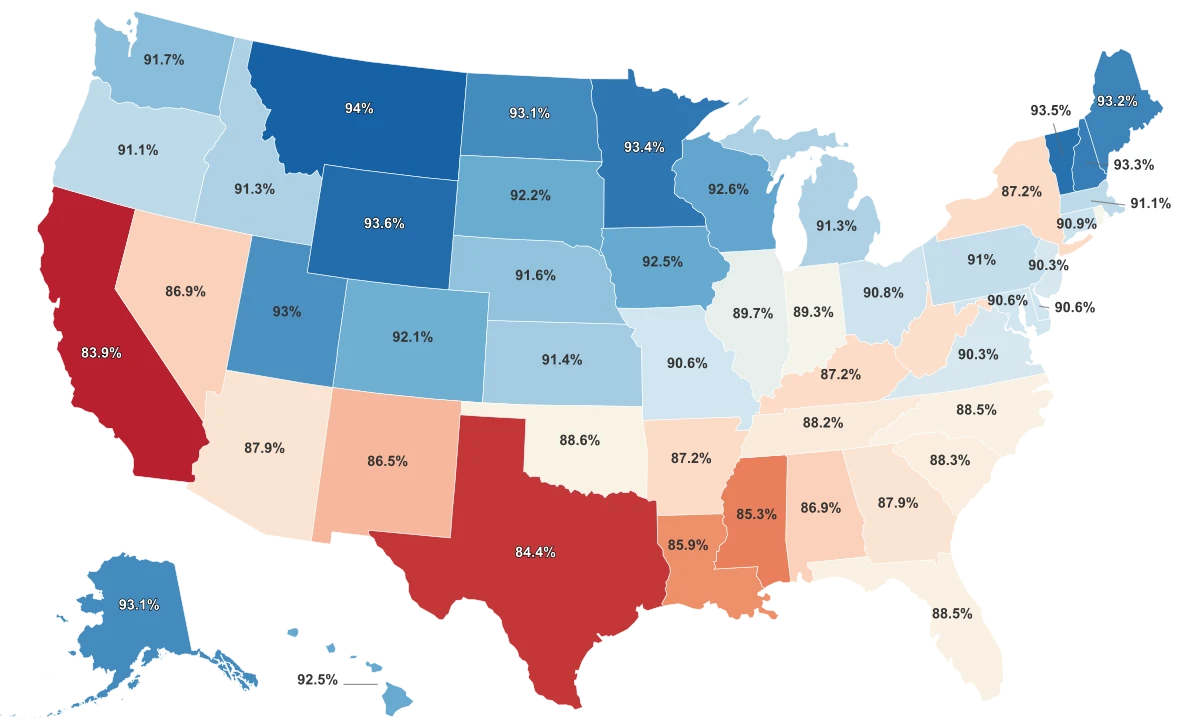
% of population that successfully completes grades 9-12 secondary education.
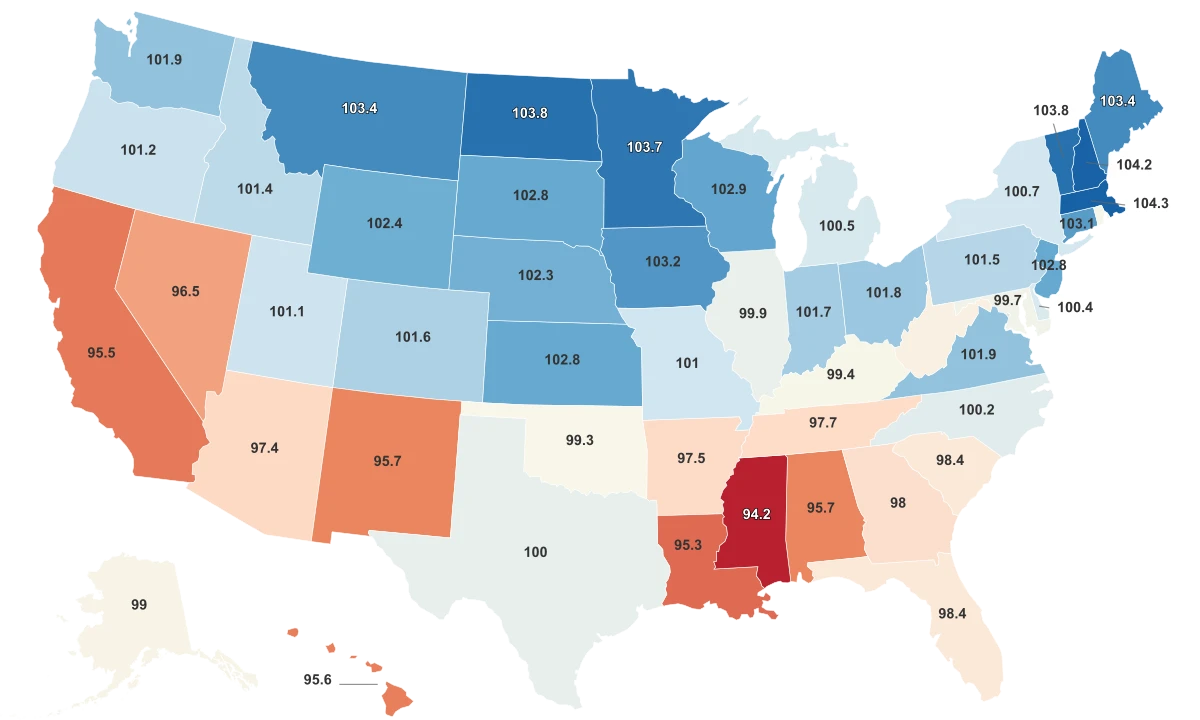
Measures average human intelligence based on standardized tests where 100 is the standard average.
Editorial Note: Data Pandas urges readers to view state-level IQ data with extreme skepticism. The psychological and scientific communities heavily criticize the methodology of estimating aggregate state IQs, as standardized tests contain inherent cultural, linguistic, and economic biases