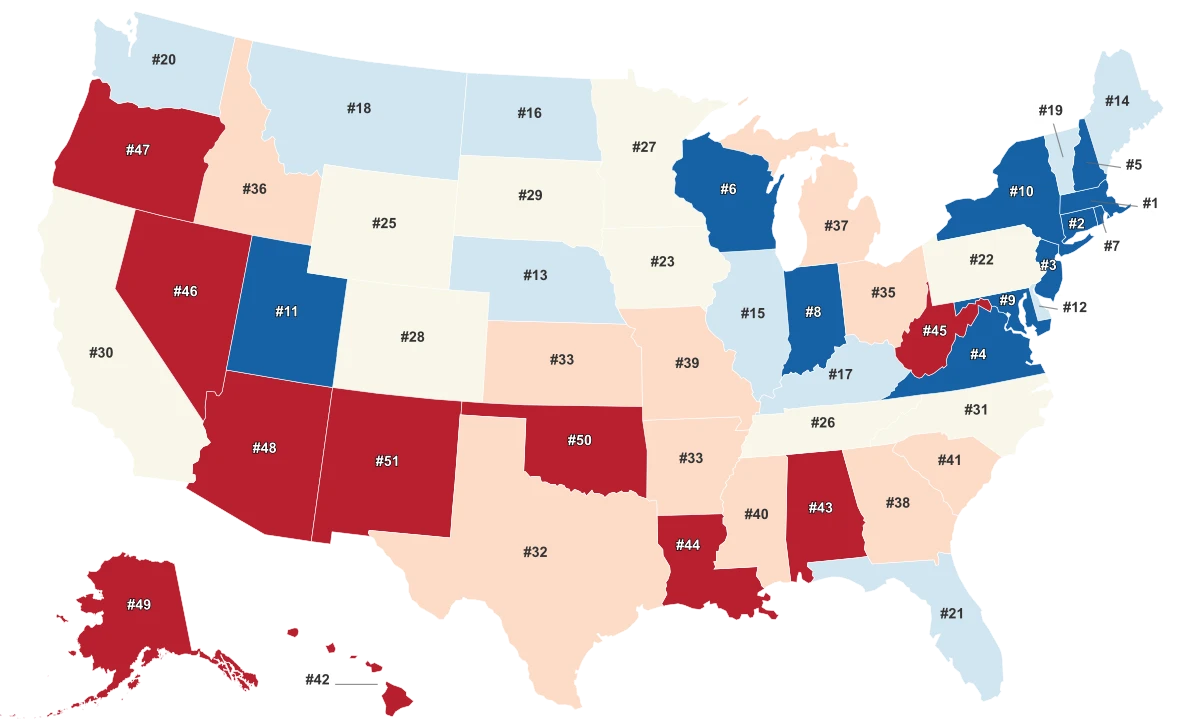
Average IQ By State

1 | Massachusetts | 104.3 | |
2 | New Hampshire | 104.2 | |
3 | North Dakota | 103.8 | |
3 | Vermont | 103.8 | |
5 | Minnesota | 103.7 | |
6 | Maine | 103.4 | |
6 | Montana | 103.4 | |
8 | Iowa | 103.2 | |
9 | Connecticut | 103.1 | |
10 | Wisconsin | 102.9 | |
11 | New Jersey | 102.8 | |
11 | South Dakota | 102.8 | |
11 | Kansas | 102.8 | |
14 | Wyoming | 102.4 | |
15 | Nebraska | 102.3 | |
16 | Virginia | 101.9 | |
16 | Washington | 101.9 | |
18 | Ohio | 101.8 | |
19 | Indiana | 101.7 | |
20 | Colorado | 101.6 | |
21 | Pennsylvania | 101.5 | |
22 | Idaho | 101.4 | |
23 | Oregon | 101.2 | |
24 | Utah | 101.1 | |
25 | Missouri | 101 | |
26 | New York | 100.7 | |
27 | Michigan | 100.5 | |
28 | Delaware | 100.4 | |
29 | North Carolina | 100.2 | |
30 | Texas | 100 | |
31 | Illinois | 99.9 | |
32 | Maryland | 99.7 | |
33 | Rhode Island | 99.5 | |
34 | Kentucky | 99.4 | |
35 | Oklahoma | 99.3 | |
36 | Alaska | 99 | |
37 | West Virginia | 98.7 | |
38 | Florida | 98.4 | |
38 | South Carolina | 98.4 | |
40 | Georgia | 98 | |
41 | Tennessee | 97.7 | |
42 | Arkansas | 97.5 | |
43 | Arizona | 97.4 | |
44 | Nevada | 96.5 | |
45 | Alabama | 95.7 | |
45 | New Mexico | 95.7 | |
47 | Hawaii | 95.6 | |
48 | California | 95.5 | |
49 | Louisiana | 95.3 | |
50 | Mississippi | 94.2 |
Last updated June 23, 2026
Key Takeaways
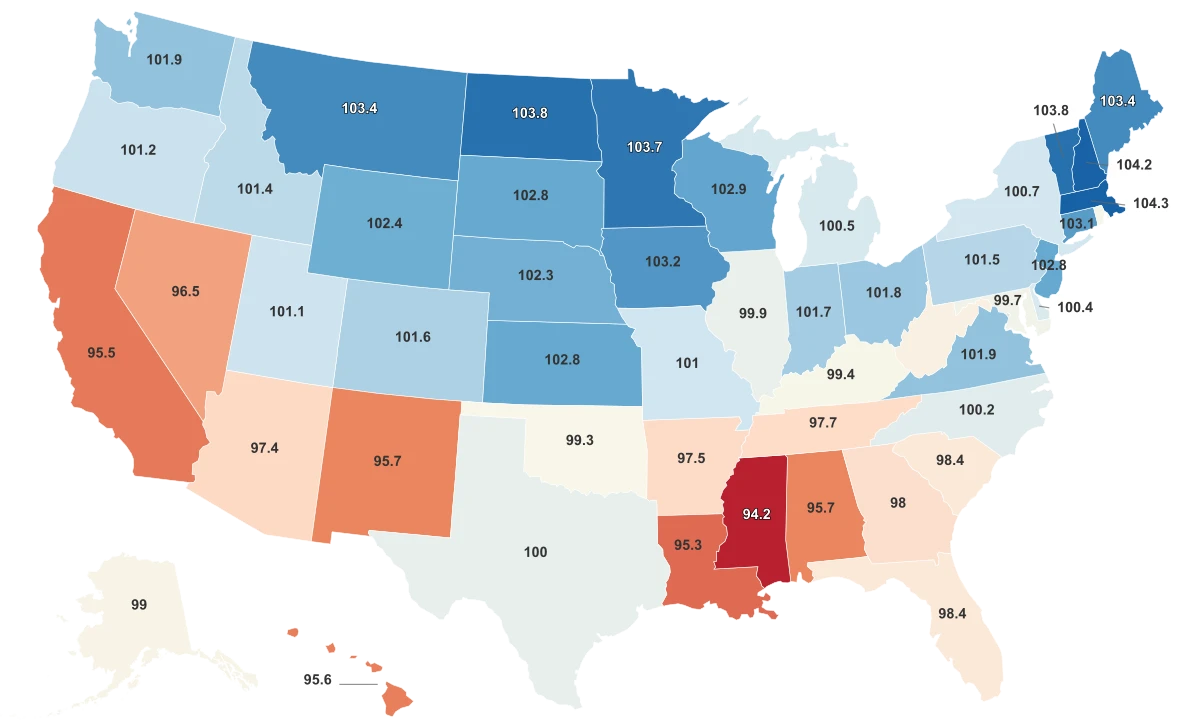
- Massachusetts posts the highest estimate at 104.3, just ahead of New Hampshire at 104.2.
- Mississippi sits lowest at 94.2, the only state that falls clearly apart from the pack.
- The full spread runs 10.1 points, with most states landing within a few points of the national standard of 100.
- Where students finish high school predicts the score far better than what their state spends: completion explains roughly 59% of the variation, per-pupil spending only about 17%.
All Metrics
What a State's 'Average IQ' Actually Measures
Massachusetts holds the top spot in this dataset at 104.3, with Mississippi at the bottom at 94.2, a spread of just over ten points across all 50 states. Before reading anything into that order, it helps to know what the number is. It is not a measured-intelligence census of any population. It is a 2006 academic estimate, published in the journal Intelligence, that derives each state's figure from standardized school-test performance, with 100 set as the national standard.
The method matters because it tells you how to read the table. The researcher built it by analyzing NAEP math and reading results from fourth and eighth graders in each state, so a higher number means a state's students performed better on school assessments, not that its people are smarter or more capable. Most states sit within a few points of 100, and only Mississippi breaks clearly below the rest. The estimate is also roughly two decades old, which makes it a snapshot of educational infrastructure in the mid-2000s rather than a current-day reading.
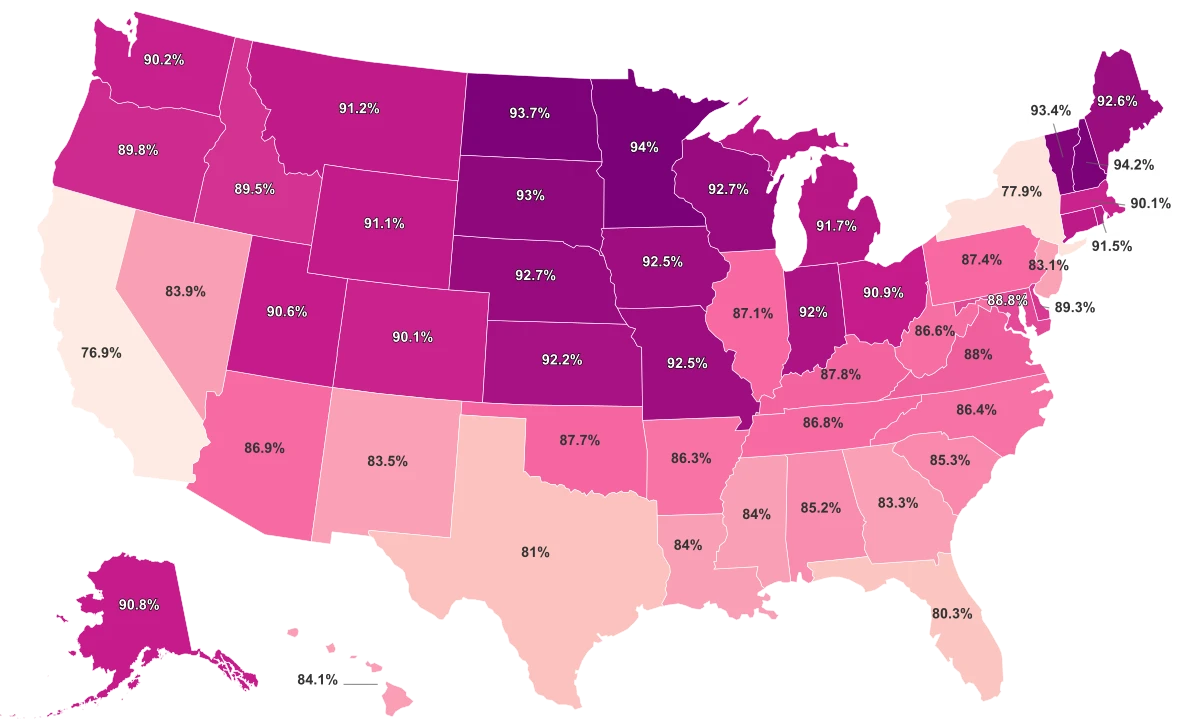
The States That Finish School Are the States That Score
If the score is a readout of schooling, the clearest place to see it is high school completion. Across the 50 states, the two move together almost in lockstep: the states where the largest share of adults finished grades nine through twelve are the same states that sit near the top of the estimate, and completion alone accounts for roughly 59% of the variation in the score. That is the strongest relationship anywhere in this data.
Where Students Finish School, the Score Follows
Each point is a state. States with higher high school completion rates land higher on the 2006 IQ estimate, the tightest relationship in the data.
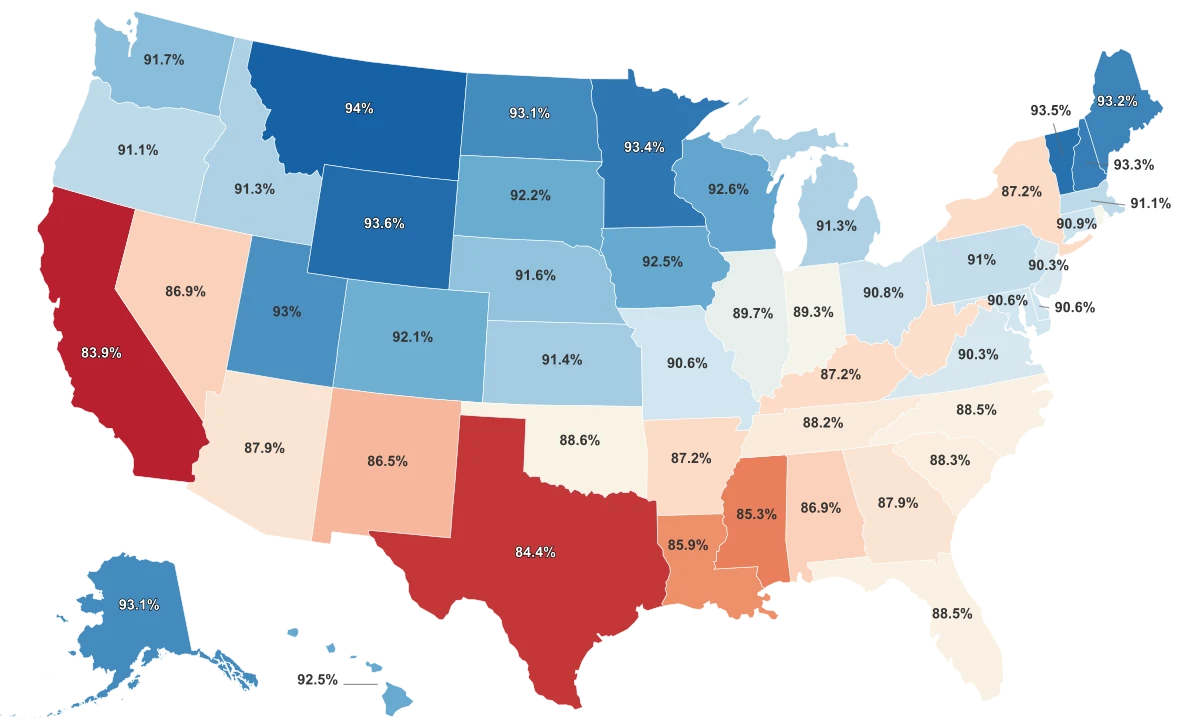
The top of the table reads like a list of strong-completion states. Massachusetts, the leader at 104.3, posts the highest scores in the country on the very NAEP assessments the estimate is built from. Literacy tells the same story from a second angle: it tracks the estimate almost as tightly, accounting for about half of its variation, so two independent measures of what students achieve point the same way. The contrast at the bottom is just as telling. California and Texas record the lowest completion rates in the dataset, at 83.9% and 84.4%, and both land below the national standard on the estimate. What students complete, more than anything else here, is what the number follows.
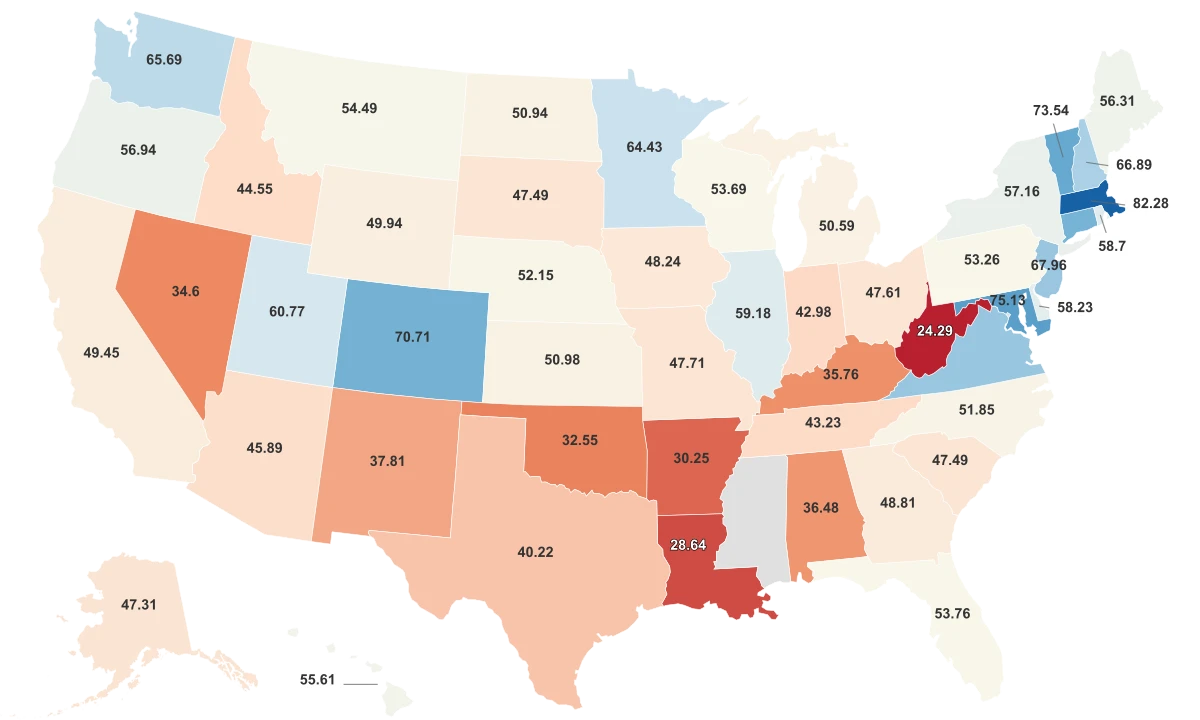
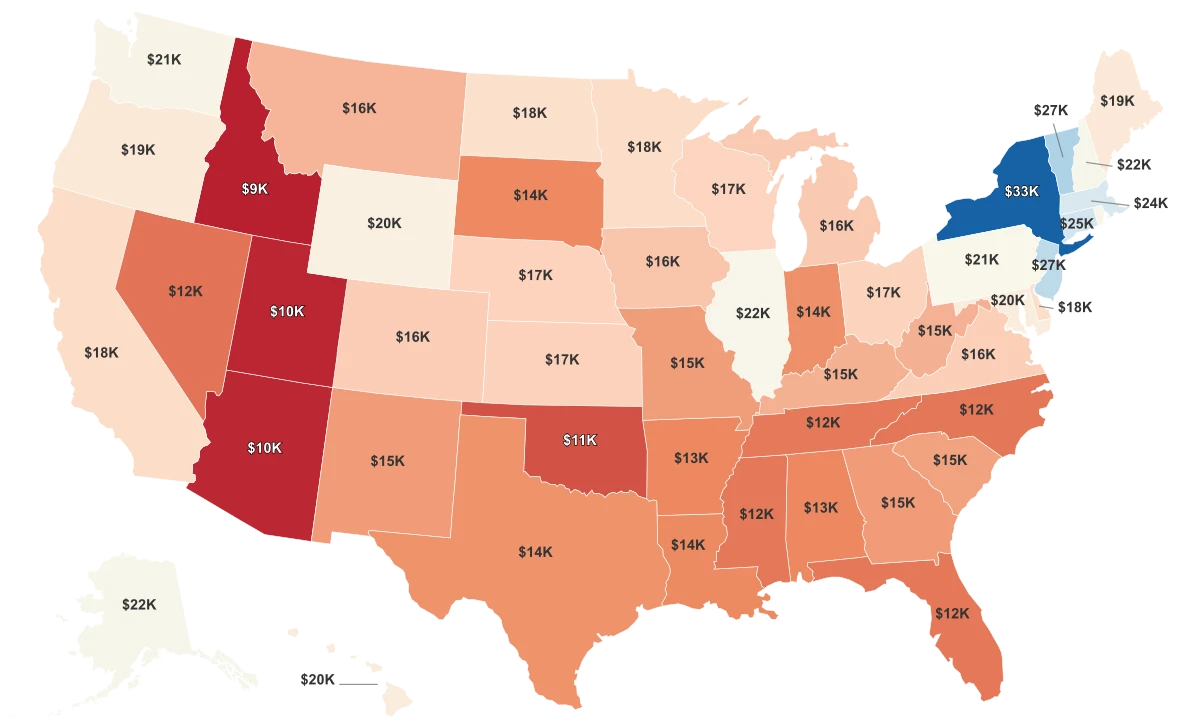
Why the Biggest Spenders Don't Top the Table
The intuitive fix for a low score is more money, and the data is the place that argument runs aground. Per-pupil spending does move with the estimate, but far more weakly than achievement does, explaining only about a sixth of the variation against completion's three-fifths. The biggest spenders are not the states that top the table. New York spends the most in the country at $33.4K per pupil, and Vermont the second most at $27.0K, yet both sit below the leaders on the estimate.
The mismatch runs the other way too. Idaho and Utah spend the least of any states, near $9.4K and $10.0K per pupil, and both still land above the national standard. The pattern matches what researchers find at exactly this level: per-pupil spending is only weakly related to test scores, and "improving schools is not, in general, a mere matter of money". The lever that moves this number is what students achieve, not the size of the check that funds them.
The Map Splits North and South, and So Does the Classroom
Grouped by region, the estimate falls into a clean order. Northeast and Midwest states average about 102.6 and 102.2, while Western and Southern states average about 99.4 and 98.4. That gap is real in the data, but it is the same shape as those regions' completion and literacy gaps, which is to say it is a map of schooling outcomes, not of people.
The most useful proof that these outcomes are movable comes from the state at the very bottom. The 2006 estimate predates it, but Mississippi later raised its fourth-grade reading scores by ten points between 2013 and 2019 after a 2013 early-literacy law, with the reporting careful that the policy explains the gains only partly. A state shifting the test inputs behind this kind of estimate by that much, in six years, is the clearest signal in the whole picture that the number reads out educational infrastructure a state can change, not anything fixed about who lives there.
Sources & Notes
Measures average human intelligence based on standardized tests where 100 is the standard average.
Editorial Note: Data Pandas urges readers to view state-level IQ data with extreme skepticism. The psychological and scientific communities heavily criticize the methodology of estimating aggregate state IQs, as standardized tests contain inherent cultural, linguistic, and economic biases
% of population that successfully completes grades 9-12 secondary education.