Welfare Recipients By State

1— | California | 5,496,920+231.4K (+4.4%) | |
2— | Texas | 3,489,634+247.9K (+7.6%) | |
3— | Florida | 3,026,108+56.9K (+1.9%) | |
4— | New York | 2,974,909+82.3K (+2.8%) | |
5▲1 | Pennsylvania | 1,984,515+43.1K (+2.2%) | |
6▼1 | Illinois | 1,908,007-98.6K (-4.9%) | |
7▲3 | Georgia | 1,604,479+206.2K (+15%) | |
8— | Michigan | 1,508,947+73.9K (+5.2%) | |
9▼2 | North Carolina | 1,483,773-107.1K (-6.7%) | |
10▼1 | Ohio | 1,444,052+39.9K (+2.8%) | |
11— | Massachusetts | 1,098,366+11.9K (+1.1%) | |
12▲1 | Washington | 906,403-3,001 (-0.3%) | |
13▼1 | Arizona | 898,476-17.2K (-1.9%) | |
14▲2 | New Jersey | 830,058+50.7K (+6.5%) | |
15▼1 | Louisiana | 825,467-66.6K (-7.5%) | |
16▼1 | Virginia | 822,941-23.9K (-2.8%) | |
17▲2 | Oregon | 774,581+38.1K (+5.2%) | |
18▼1 | Alabama | 742,614-32.8K (-4.2%) | |
19▲2 | Oklahoma | 701,611+19K (+2.8%) | |
20— | Wisconsin | 700,370-4,571 (-0.6%) | |
21▼3 | Tennessee | 695,903-50.2K (-6.7%) | |
22— | Maryland | 680,346+10K (+1.5%) | |
23— | Missouri | 659,962+4,282 (+0.7%) | |
24▲2 | Colorado | 620,478+46.3K (+8.1%) | |
25— | Indiana | 600,776+1,780 (+0.3%) | |
26▲1 | Kentucky | 582,803+27.6K (+5.0%) | |
27▼3 | South Carolina | 569,075-67K (-11%) | |
28— | Nevada | 503,643+5,085 (+1.0%) | |
29— | New Mexico | 471,266-9,279 (-1.9%) | |
30— | Minnesota | 451,151-7,212 (-1.6%) | |
31▲1 | Connecticut | 377,990-18.8K (-4.7%) | |
32▼1 | Mississippi | 369,036-28.7K (-7.2%) | |
33— | West Virginia | 273,926-19.6K (-6.7%) | |
34▲1 | Iowa | 261,142-1,684 (-0.6%) | |
35▼1 | Arkansas | 239,627-29.4K (-11%) | |
36— | Kansas | 187,290-2,916 (-1.5%) | |
37▲1 | Utah | 178,282+19.6K (+12%) | |
38▼1 | Maine | 171,238+3,351 (+2.0%) | |
39— | Hawaii | 155,843-1,289 (-0.8%) | |
40— | Nebraska | 151,994-4,807 (-3.1%) | |
41— | District of Columbia | 141,346 | |
42▼1 | Rhode Island | 138,264-3,774 (-2.7%) | |
43▼1 | Idaho | 134,855+9,219 (+7.3%) | |
44▼1 | Delaware | 119,497-2,003 (-1.6%) | |
45▼1 | Montana | 80,591-4,130 (-4.9%) | |
46▼1 | New Hampshire | 76,174-1,263 (-1.6%) | |
47— | South Dakota | 75,412+3,916 (+5.5%) | |
48▼2 | Vermont | 65,808-7,421 (-10%) | |
49▼1 | Alaska | 63,474+9,413 (+17%) | |
50▼1 | North Dakota | 55,532+10.3K (+23%) | |
51▼1 | Wyoming | 28,334-1,270 (-4.3%) |
Last updated April 1, 2026
Forty-Two Million Americans Are on Food Stamps. The Map Misleads.
The federal government's Supplemental Nutrition Assistance Program, still commonly called food stamps, is the largest nutritional safety net in the country. As of 2025, roughly 42 million Americans receive SNAP benefits every month, according to the USDA Food and Nutrition Service. That is about one in eight people.
The states with the most recipients are the states with the most people. California leads with 5.5 million. The next four in line are also among the most populous states in the country. Together, the top five account for 40% of all SNAP recipients nationwide. The count tells you more about population than about need.
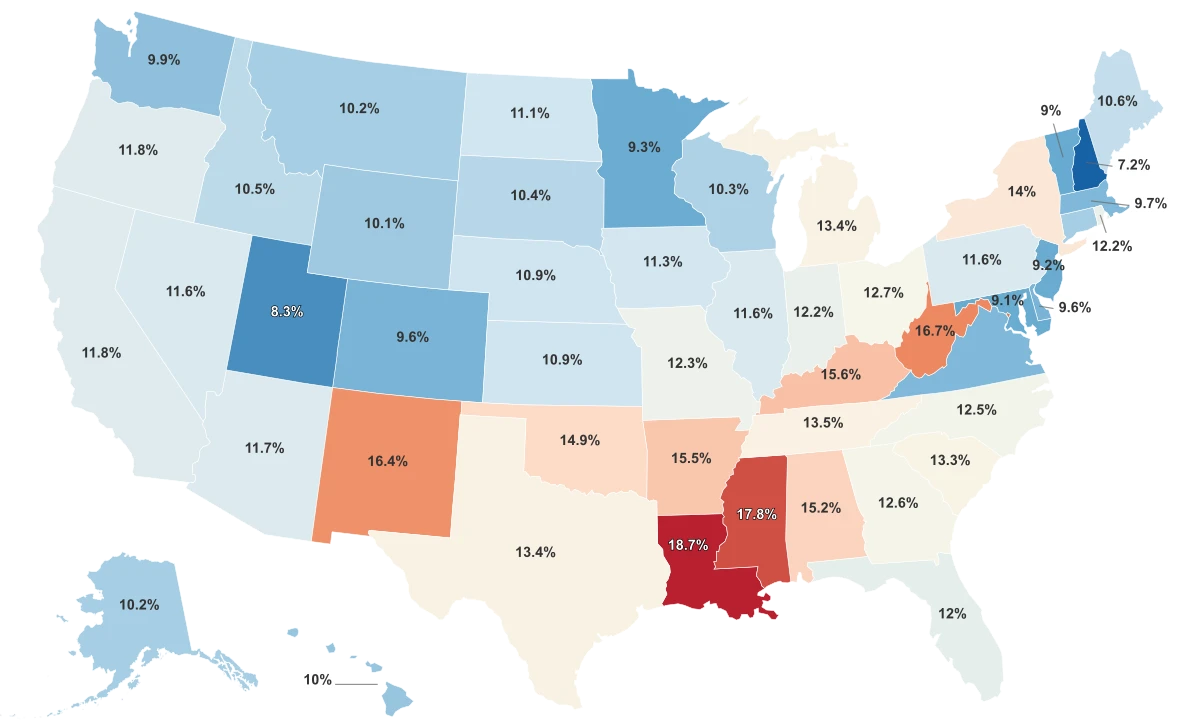
The poverty rate tells a different story. Louisiana leads the nation at 18.7%. Mississippi follows at 17.8%. At the other end, New Hampshire has the lowest rate at 7.2%. The gap from top to bottom is 11.5 percentage points: a resident of Louisiana is more than twice as likely to live below the poverty line as a resident of New Hampshire.
The disconnect matters. California, with the most SNAP recipients by far, has a poverty rate of just 11.8%, below the national average. Mississippi, with the second-highest poverty rate, has only 369,000 recipients. Volume follows population; poverty follows policy.
All Metrics
| Region ↕ | Snap Recipients 2025↕ | Poverty Rate 2023↕ | Median Household Income 2023↕ | Max Unemployment Benefits 2021↕ |
|---|---|---|---|---|
| California | 5.50M | |||
| Texas | 3.49M | |||
| Florida | 3.03M | |||
| New York | 2.97M | |||
| Pennsylvania | 1.98M | |||
| Illinois | 1.91M | |||
| Georgia | 1.60M | |||
| Michigan | 1.51M | |||
| North Carolina | 1.48M | |||
| Ohio | 1.44M | |||
| Massachusetts | 1.10M | |||
| Washington | 906.4K | |||
| Arizona | 898.5K | |||
| New Jersey | 830.1K | |||
| Louisiana | 825.5K | |||
| Virginia | 822.9K | |||
| Oregon | 774.6K | |||
| Alabama | 742.6K | |||
| Oklahoma | 701.6K | |||
| Wisconsin | 700.4K | |||
| Tennessee | 695.9K | |||
| Maryland | 680.3K | |||
| Missouri | 660K | |||
| Colorado | 620.5K | |||
| Indiana | 600.8K | |||
| Kentucky | 582.8K | |||
| South Carolina | 569.1K | |||
| Nevada | 503.6K | |||
| New Mexico | 471.3K | |||
| Minnesota | 451.2K | |||
| Connecticut | 378K | |||
| Mississippi | 369K | |||
| West Virginia | 273.9K | |||
| Iowa | 261.1K | |||
| Arkansas | 239.6K | |||
| Kansas | 187.3K | |||
| Utah | 178.3K | |||
| Maine | 171.2K | |||
| Hawaii | 155.8K | |||
| Nebraska | 152K | |||
| District of Columbia | 141.3K | |||
| Rhode Island | 138.3K | |||
| Idaho | 134.9K | |||
| Delaware | 119.5K | |||
| Montana | 80.6K | |||
| New Hampshire | 76.2K | |||
| South Dakota | 75.4K | |||
| Vermont | 65.8K | |||
| Alaska | 63.5K | |||
| North Dakota | 55.5K | |||
| Wyoming | 28.3K |
Why the Poorest States Are Almost All in the South
Eight of the nine states with the highest poverty rates sit below the Mason-Dixon line. The South averages a poverty rate of 13.96%, compared to 11.37% in the Midwest, 10.93% in the West, and 10.41% in the Northeast. That gap has persisted for decades.
The reasons are structural. A 2020 study by Regina S. Baker, published in Social Forces, found that "power resources," a category encompassing unionization rates and social policy generosity, were the most influential factors explaining the Southern poverty gap. Every former Confederate state is a right-to-work state. Unionization rates in the South average roughly half the national figure.
The Economic Policy Institute describes a "Southern economic development model" built around low wages, low taxes, few labor protections, and weak public investment. The strategy attracts businesses with cheap labor and minimal regulation. It also produces lower household incomes: the South's median household income averages $38,924, roughly $3,500 less than the Northeast and the West.
District of Columbia breaks the pattern. Its median household income of $75,800 is the highest in the dataset, more than double Mississippi's $27,200. Yet its poverty rate sits at 17.3%, the third highest. That is extreme inequality compressed into 68 square miles: a city where federal employees earn six figures blocks away from neighborhoods where one in four residents lives in poverty.
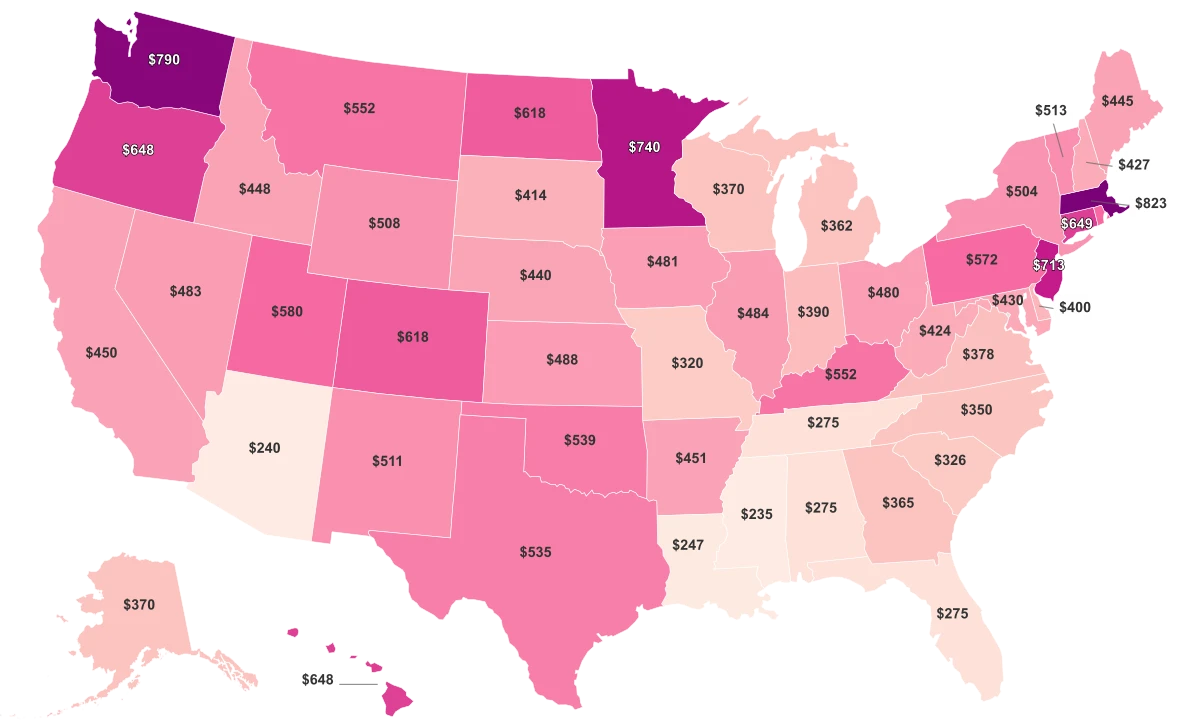
Massachusetts Pays $823 a Week in Unemployment. Mississippi Pays $235.
The maximum weekly unemployment benefit in Massachusetts is $823. In Mississippi, it is $235. That is a gap of more than 3.5 times: a laid-off worker in Boston collects roughly $3,300 a month in unemployment insurance while the same worker in Jackson gets less than a thousand.
The pattern is regional. Northeastern states average $581 per week in maximum benefits. The South averages just $379, about two-thirds of that. At the very bottom, Arizona caps benefits at $240 per week, barely above Mississippi.
States With Weaker Safety Nets Tend to Have Higher Poverty
Poverty Rate vs. Maximum Weekly Unemployment Benefits across all 50 states and D.C. States that offer less generous benefits cluster toward higher poverty rates.
The relationship between weak safety nets and high poverty is not one-directional. A worker who loses a job in a low-benefit state has less of a financial cushion, is more likely to accept a lower-paying replacement quickly, and is more likely to fall below the poverty line in the interim. That keeps wages low and poverty persistent. The EPI argues this feedback loop is a feature of the Southern economic model, not a flaw in it.
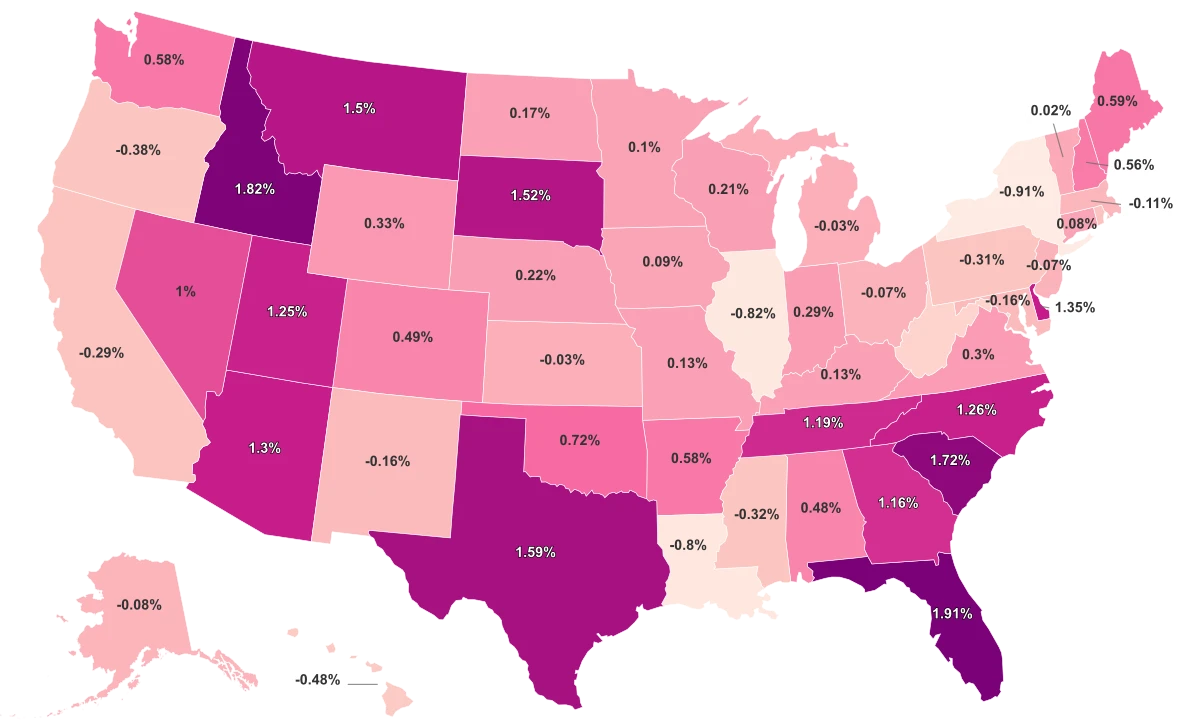
Some States Added Millions to SNAP. Others Cut Them Off.
Between 2019 and 2025, national SNAP enrollment grew by 12.77%. But the national average hides a widening split between states expanding access and states restricting it.
Massachusetts saw the sharpest percentage jump: its SNAP rolls grew 43.9% since 2019, reaching 1.1 million recipients. California added 1.5 million people to CalFresh, a 37.5% increase.
Part of the explanation is policy. California sets its income eligibility threshold at 200% of the federal poverty level through a provision called Broad-Based Categorical Eligibility, nearly double the federal baseline. That wider net pulls in working families who would be ineligible in most other states.
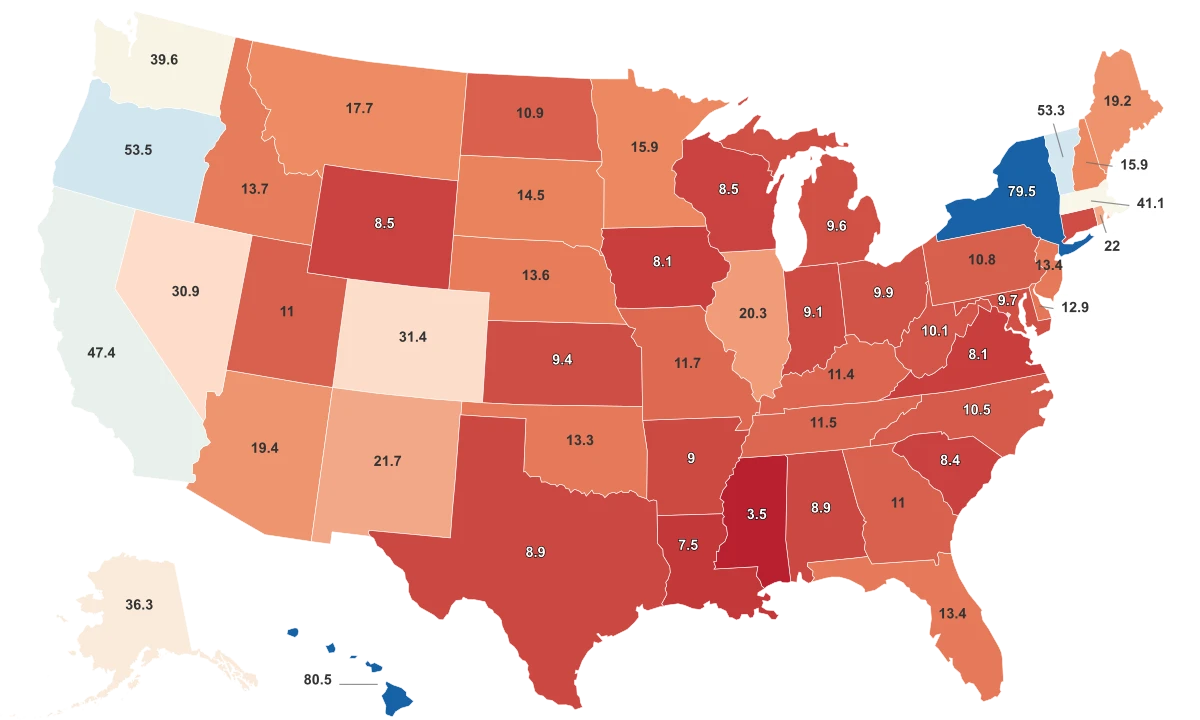
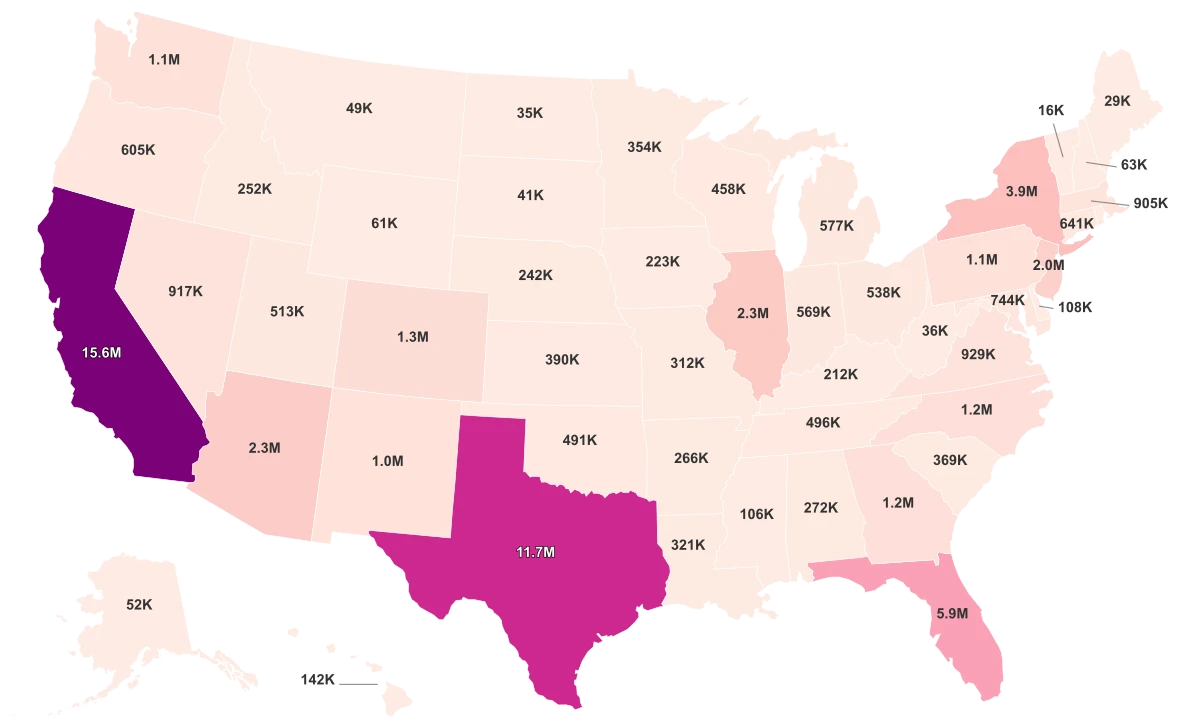
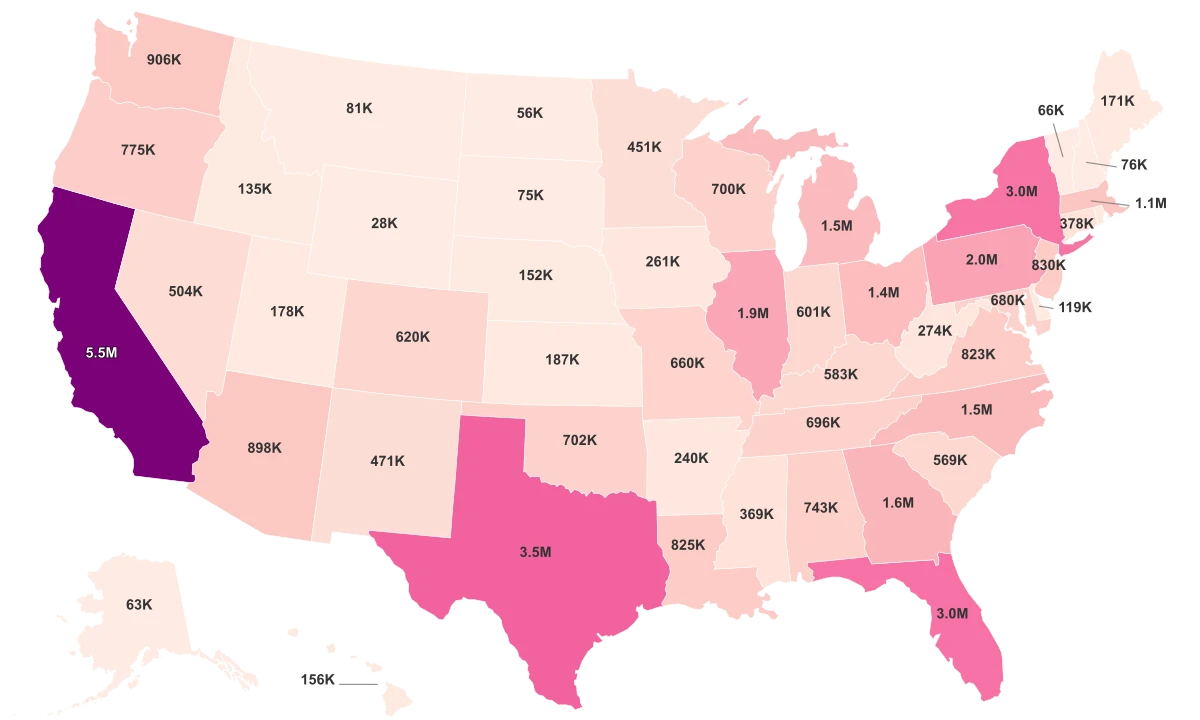
SNAP Enrollment Surged in Some States and Collapsed in Others
Total SNAP recipients by state, 2019 vs. 2025. California and Massachusetts led the growth while Tennessee and Arkansas saw steep declines.
The states shrinking fastest are almost entirely Southern. Arkansas lost 31.6% of its SNAP caseload since 2019. Tennessee lost 21.2%, falling 10 spots in the rankings. Mississippi lost 16.2%. These states were among the first to end pandemic-era emergency allotments, and all three impose strict work requirements with limited waivers.
The gap is about to widen further. A federal law signed in July 2025 expanded SNAP work requirements to adults ages 55 through 64 and removed exemptions for veterans and former foster youth. The Congressional Budget Office projects these changes will cut roughly 2.4 million people from the program, with the heaviest losses concentrated in states that already have the weakest safety nets.
Sources & Notes
Number of people receiving Supplemental Nutrition Assistance Program (SNAP) benefits.
% of the population living below the national poverty line.
Middle household income value, with half of households earning more and half earning less.
Maximum unemployment compensation amount available to eligible individuals.