Sunniest States

1 | Arizona | 5,755kJ/m² | |
2 | New Mexico | 5,642kJ/m² | |
3 | Nevada | 5,296kJ/m² | |
4 | Texas | 5,137kJ/m² | |
5 | California | 5,050kJ/m² | |
6 | Colorado | 4,960kJ/m² | |
7 | Oklahoma | 4,912kJ/m² | |
8 | Kansas | 4,890kJ/m² | |
9 | Utah | 4,887kJ/m² | |
10 | Florida | 4,859kJ/m² | |
11 | Louisiana | 4,725kJ/m² | |
11 | Arkansas | 4,725kJ/m² | |
13 | Mississippi | 4,693kJ/m² | |
14 | Nebraska | 4,685kJ/m² | |
15 | Georgia | 4,661kJ/m² | |
16 | Alabama | 4,660kJ/m² | |
17 | South Carolina | 4,624kJ/m² | |
18 | Missouri | 4,545kJ/m² | |
19 | Tennessee | 4,486kJ/m² | |
20 | Wyoming | 4,471kJ/m² | |
21 | North Carolina | 4,466kJ/m² | |
22 | Kentucky | 4,383kJ/m² | |
23 | Illinois | 4,380kJ/m² | |
24 | Virginia | 4,354kJ/m² | |
25 | South Dakota | 4,332kJ/m² | |
26 | Iowa | 4,331kJ/m² | |
27 | Indiana | 4,318kJ/m² | |
28 | Maryland | 4,267kJ/m² | |
29 | Idaho | 4,251kJ/m² | |
30 | Delaware | 4,232kJ/m² | |
31 | West Virginia | 4,146kJ/m² | |
32 | Ohio | 4,139kJ/m² | |
33 | New Jersey | 4,056kJ/m² | |
34 | Wisconsin | 4,023kJ/m² | |
35 | Michigan | 4,018kJ/m² | |
36 | Rhode Island | 3,989kJ/m² | |
37 | Connecticut | 3,988kJ/m² | |
38 | Minnesota | 3,968kJ/m² | |
39 | Massachusetts | 3,944kJ/m² | |
40 | Pennsylvania | 3,939kJ/m² | |
41 | North Dakota | 3,925kJ/m² | |
42 | New York | 3,904kJ/m² | |
43 | New Hampshire | 3,891kJ/m² | |
44 | Montana | 3,847kJ/m² | |
45 | Oregon | 3,830kJ/m² | |
46 | Vermont | 3,826kJ/m² | |
47 | Maine | 3,815kJ/m² | |
48 | Washington | 3,467kJ/m² |
Last updated April 1, 2026
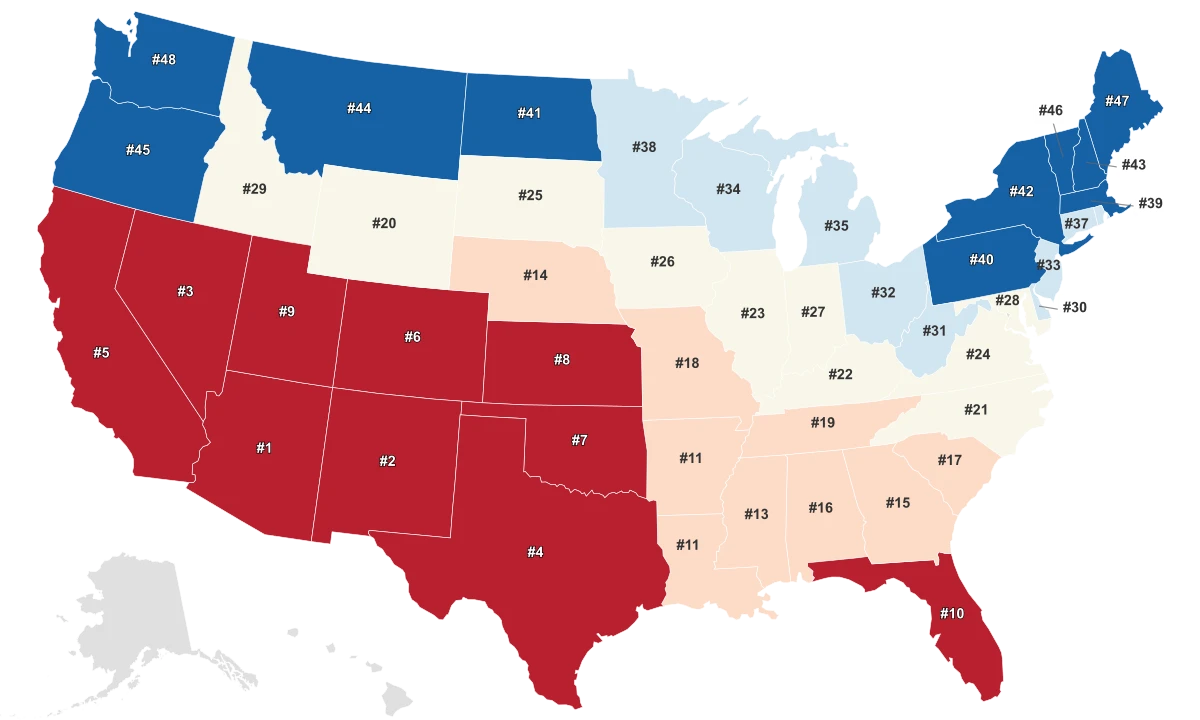
The Desert Southwest Gets More Sun Than Anywhere Else in the Country
Arizona leads the country in average annual sunlight at 5,755 kJ/m², roughly 66% more solar energy than last-place Washington at 3,467 kJ/m². That gap is not gradual. Arizona and New Mexico (5,642 kJ/m²) sit far above the rest of the field, and then the rankings flatten into a long, steady decline through the remaining 46 states.
The reason is aridity, not latitude. Both states sit in the Sonoran and Chihuahuan Deserts, where extremely low humidity starves the atmosphere of the moisture it needs to build clouds. Yuma, Arizona, holds a Guinness World Record as the sunniest city on Earth: sunshine during roughly 91% of all daylight hours, more than 4,000 hours of sun per year, and about 308 clear days annually.
Arizona also leads in number of sunny days at 193, followed again by New Mexico at 167. No other state cracks 160. After those two, Nevada (158 sunny days) and California (146) fill out the top four, keeping the podium firmly in the arid West. The regional averages confirm the pattern: Western states average 4,678,000 kJ/m² of annual sunlight, compared to 3,928,000 kJ/m² in the Northeast, a difference of roughly 19%.
All Metrics
| Region ↕ | Average Annual Sunlight 2019↕ | # of Sunny Days↕ | Average Temperature 2024↕ |
|---|---|---|---|
| Arizona | 5,755 kJ/m² | ||
| New Mexico | 5,642 kJ/m² | ||
| Nevada | 5,296 kJ/m² | ||
| Texas | 5,137 kJ/m² | ||
| California | 5,050 kJ/m² | ||
| Colorado | 4,960 kJ/m² | ||
| Oklahoma | 4,912 kJ/m² | ||
| Kansas | 4,890 kJ/m² | ||
| Utah | 4,887 kJ/m² | ||
| Florida | 4,859 kJ/m² | ||
| Louisiana | 4,725 kJ/m² | ||
| Arkansas | 4,725 kJ/m² | ||
| Mississippi | 4,693 kJ/m² | ||
| Nebraska | 4,685 kJ/m² | ||
| Georgia | 4,661 kJ/m² | ||
| Alabama | 4,660 kJ/m² | ||
| South Carolina | 4,624 kJ/m² | ||
| Missouri | 4,545 kJ/m² | ||
| Tennessee | 4,486 kJ/m² | ||
| Wyoming | 4,471 kJ/m² | ||
| North Carolina | 4,466 kJ/m² | ||
| Kentucky | 4,383 kJ/m² | ||
| Illinois | 4,380 kJ/m² | ||
| Virginia | 4,354 kJ/m² | ||
| South Dakota | 4,332 kJ/m² | ||
| Iowa | 4,331 kJ/m² | ||
| Indiana | 4,318 kJ/m² | ||
| Maryland | 4,267 kJ/m² | ||
| Idaho | 4,251 kJ/m² | ||
| Delaware | 4,232 kJ/m² | ||
| West Virginia | 4,146 kJ/m² | ||
| Ohio | 4,139 kJ/m² | ||
| New Jersey | 4,056 kJ/m² | ||
| Wisconsin | 4,023 kJ/m² | ||
| Michigan | 4,018 kJ/m² | ||
| Rhode Island | 3,989 kJ/m² | ||
| Connecticut | 3,988 kJ/m² | ||
| Minnesota | 3,968 kJ/m² | ||
| Massachusetts | 3,944 kJ/m² | ||
| Pennsylvania | 3,939 kJ/m² | ||
| North Dakota | 3,925 kJ/m² | ||
| New York | 3,904 kJ/m² | ||
| New Hampshire | 3,891 kJ/m² | ||
| Montana | 3,847 kJ/m² | ||
| Oregon | 3,830 kJ/m² | ||
| Vermont | 3,826 kJ/m² | ||
| Maine | 3,815 kJ/m² | ||
| Washington | 3,467 kJ/m² |
Florida Is the Sunshine State. It Is Not the Sunniest.
Florida adopted "The Sunshine State" as its official nickname in 1970. It was a tourism pitch, not a weather report. In total solar energy, Florida ranks 10th at 4,859 kJ/m², a respectable number. But in actual clear-sky days, the count drops to just 101, tied for 24th with Louisiana and Maine.
The culprit is the sea breeze. Florida is a narrow peninsula flanked by the Gulf of Mexico to the west and the Atlantic to the east. On summer afternoons, the land heats faster than the surrounding water, pulling cool, moist air inland from both coasts. When those two sea breezes collide over the interior, the moisture gets shoved upward and builds into towering thunderheads. Central Florida averages more afternoon thunderstorms than almost anywhere else in the country.
The result is a state that gets intense sunshine for much of the morning, then loses it to clouds and rain by 3 p.m. The high subtropical sun angle and long daylight hours still deliver strong total radiation, which is why Florida's kJ/m² figure stays competitive. But for someone who wants uninterrupted blue sky from sunrise to sunset, Arizona's 193 clear days are nearly double Florida's 101.
Hawaii tells a similar story in miniature. Its trade winds and mountainous terrain produce localized cloud cover and frequent rain showers, especially on windward slopes. Hawaii logs only 90 sunny days per year, placing it 36th out of 50 states, despite a reputation as a tropical paradise.
The Cascades Built a Wall of Clouds
At the bottom of the rankings, a different kind of geography takes over. Washington receives less annual sunlight than any other state in the dataset: 3,467 kJ/m², nearly 40% less than Arizona. It also records just 58 sunny days per year, tied for last with Vermont.
The Cascade Range is the primary reason. Moisture-laden winds blow inland from the Pacific Ocean, and when they hit the Cascades, the air is forced upward. As it rises, it cools and condenses into a thick, persistent cloud layer that blankets everything west of the mountains. Seattle, Portland, and the rest of the I-5 corridor live under this gray ceiling for much of the fall, winter, and spring.
Oregon sits just above Washington with 3,830 kJ/m² in solar energy and 68 sunny days. The same orographic lift drives Oregon's cloudiness, though Portland gets slightly more summer clearing than Seattle. East of the Cascades, both states are dramatically sunnier, but the statewide averages are pulled down by the wet western corridors where most residents live.
The cloudiest states are not all in the Pacific Northwest, though. West Virginia logs just 60 sunny days, one of the lowest counts in the country. Ohio manages only 72. Both are affected by moisture from the Great Lakes and persistent winter overcast. The Northeast averages just 85.7 sunny days per year, compared to 116.8 in the West, a gap of more than a month of blue sky.
Total Energy and Clear Skies Measure Different Things
Solar energy and sunny days track closely, but they are not measuring the same thing. A state can receive massive total radiation without many picture-perfect clear days, or it can log plenty of clear skies without topping the energy rankings.
Total Solar Energy and Clear Days Track Closely, but Not Perfectly
States in the desert Southwest dominate both metrics, while Florida gets far more solar energy than its clear-day count would suggest.
Colorado is the clearest example of how the metrics diverge from temperature. It ranks 6th in both sunlight (4,960 kJ/m²) and sunny days (136), but its average temperature is just 47.6°F, ranking 40th out of 50 states. Colorado's high elevation gives it thin, dry air that lets solar radiation pour through with minimal atmospheric filtering, even while winter temperatures plunge. Nevada shows the same pattern: 3rd in sunlight, 3rd in sunny days, but just 27th in average temperature at 52.7°F.
The weak relationship between sunshine and temperature is visible in the regional averages. The South is the warmest region by far, averaging 63°F, but it ranks second to the West in both sunlight and sunny days. Southern states like Alabama (99 sunny days) and Kentucky (93) are warm and humid, not warm and sunny. Their cloud cover comes from Gulf moisture, not mountains, but the effect on clear-day counts is the same.
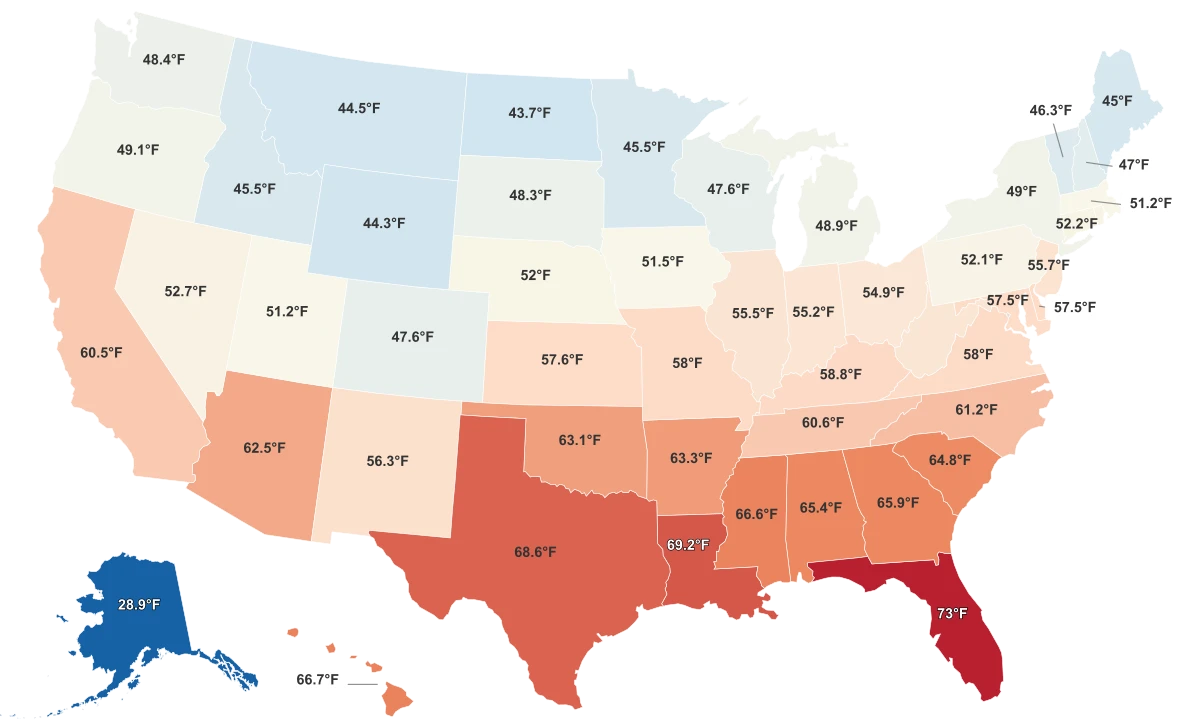
For anyone choosing where to live, the distinction matters. If the goal is vitamin D and blue sky overhead, the desert Southwest wins by a wide margin. If the goal is warm weather, the Deep South delivers the heat: Florida leads the country at 73°F, more than 44 degrees warmer than Alaska's 28.9°F. But only Arizona gives you both: abundant sunshine, clear skies, and one of the warmest winters in the country.
Sources & Notes
The Annual Sunlight the region receives in kJ/m².
Average annual temperature.