States By Population

1 |  | California | 39,663,800 |
2 |  | Texas | 31,853,800 |
3 |  | Florida | 23,839,600 |
4 |  | New York | 19,997,100 |
5 |  | Pennsylvania | 13,139,800 |
6 |  | Illinois | 12,778,100 |
7 |  | Ohio | 11,942,600 |
8 |  | Georgia | 11,297,300 |
9 |  | North Carolina | 11,210,900 |
10 |  | Michigan | 10,197,600 |
11 |  | New Jersey | 9,622,060 |
12 |  | Virginia | 8,887,700 |
13 |  | Washington | 8,059,040 |
14 |  | Arizona | 7,691,740 |
15 |  | Tennessee | 7,307,200 |
16 |  | Massachusetts | 7,205,770 |
17 |  | Indiana | 6,968,420 |
18 |  | Maryland | 6,309,380 |
19 |  | Missouri | 6,282,890 |
20 |  | Colorado | 6,013,650 |
21 |  | Wisconsin | 5,991,540 |
22 |  | Minnesota | 5,833,250 |
23 |  | South Carolina | 5,569,830 |
24 |  | Alabama | 5,197,720 |
25 |  | Kentucky | 4,626,150 |
26 |  | Louisiana | 4,607,410 |
27 |  | Oregon | 4,291,090 |
28 |  | Oklahoma | 4,126,900 |
29 |  | Connecticut | 3,707,120 |
30 |  | Utah | 3,564,000 |
31 |  | Nevada | 3,320,570 |
32 |  | Iowa | 3,264,560 |
33 |  | Arkansas | 3,107,240 |
34 |  | Kansas | 2,989,710 |
35 |  | Mississippi | 2,942,920 |
36 |  | New Mexico | 2,139,350 |
37 |  | Idaho | 2,032,120 |
38 |  | Nebraska | 2,023,070 |
39 |  | West Virginia | 1,769,460 |
40 |  | Hawaii | 1,450,900 |
41 |  | New Hampshire | 1,415,860 |
42 |  | Maine | 1,410,380 |
43 |  | Montana | 1,143,160 |
44 |  | Rhode Island | 1,121,190 |
45 |  | Delaware | 1,067,410 |
46 |  | South Dakota | 931,033 |
47 |  | North Dakota | 804,089 |
48 |  | Alaska | 743,756 |
49 |  | Vermont | 648,278 |
50 |  | Wyoming | 590,169 |
Last updated June 24, 2026
Key Takeaways
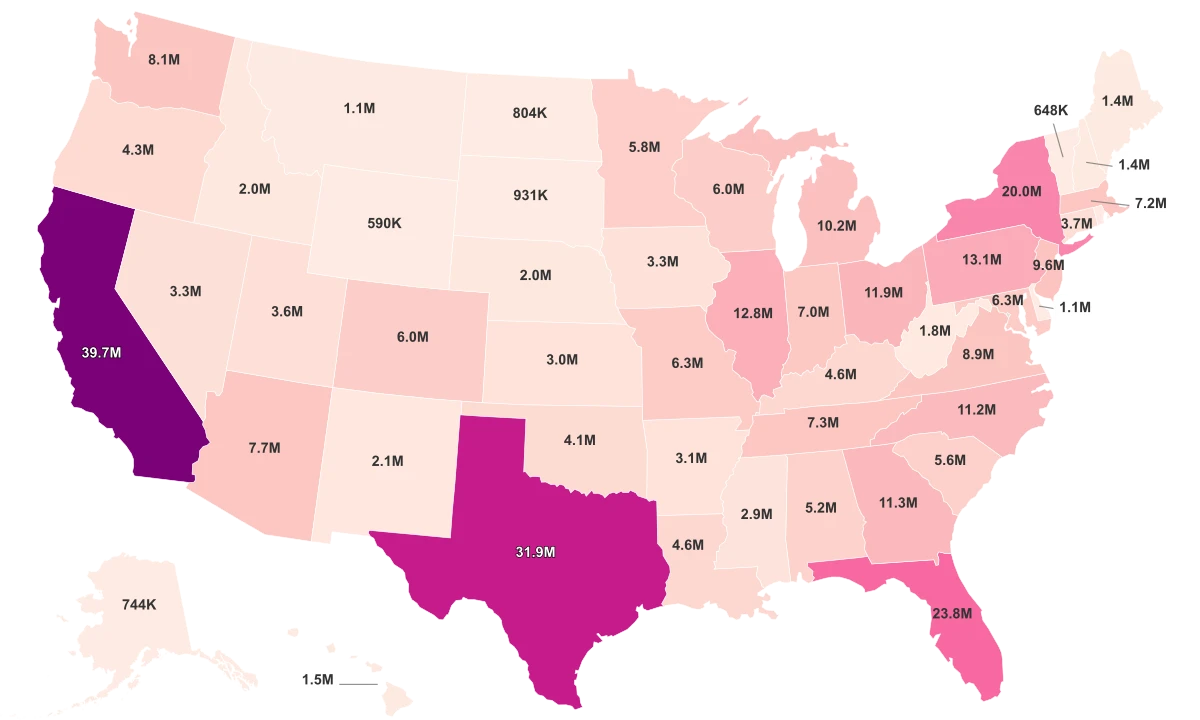
- California is the most populous state at 39.66 million people, based on the Census Bureau's 2024 estimates.
- Wyoming is the least populous at about 590,000, roughly 67 times smaller than California.
- The five largest states hold close to 37% of the entire 50-state population.
- Size does not equal crowding or growth: California sits mid-pack on density and is now losing residents, while Florida grows fastest.
All Metrics
| Region ↕ | Population 2024↕ | Population Density 2023↕ | Yearly Population Growth 2023↕ |
|---|---|---|---|
| California | 39.66M | ||
| Texas | 31.85M | ||
| Florida | 23.84M | ||
| New York | 20.00M | ||
| Pennsylvania | 13.14M | ||
| Illinois | 12.78M | ||
| Ohio | 11.94M | ||
| Georgia | 11.30M | ||
| North Carolina | 11.21M | ||
| Michigan | 10.20M | ||
| New Jersey | 9.62M | ||
| Virginia | 8.89M | ||
| Washington | 8.06M | ||
| Arizona | 7.69M | ||
| Tennessee | 7.31M | ||
| Massachusetts | 7.21M | ||
| Indiana | 6.97M | ||
| Maryland | 6.31M | ||
| Missouri | 6.28M | ||
| Colorado | 6.01M | ||
| Wisconsin | 5.99M | ||
| Minnesota | 5.83M | ||
| South Carolina | 5.57M | ||
| Alabama | 5.20M | ||
| Kentucky | 4.63M | ||
| Louisiana | 4.61M | ||
| Oregon | 4.29M | ||
| Oklahoma | 4.13M | ||
| Connecticut | 3.71M | ||
| Utah | 3.56M | ||
| Nevada | 3.32M | ||
| Iowa | 3.26M | ||
| Arkansas | 3.11M | ||
| Kansas | 2.99M | ||
| Mississippi | 2.94M | ||
| New Mexico | 2.14M | ||
| Idaho | 2.03M | ||
| Nebraska | 2.02M | ||
| West Virginia | 1.77M | ||
| Hawaii | 1.45M | ||
| New Hampshire | 1.42M | ||
| Maine | 1.41M | ||
| Montana | 1.14M | ||
| Rhode Island | 1.12M | ||
| Delaware | 1.07M | ||
| South Dakota | 931.03K | ||
| North Dakota | 804.09K | ||
| Alaska | 743.76K | ||
| Vermont | 648.28K | ||
| Wyoming | 590.17K |
California Alone Holds More People Than the 21 Smallest States Combined
Start with the headline number. California is home to 39.66 million people, more than the 21 least populous states put together. At the other end of the table, Wyoming has about 590,000 residents, which makes California roughly 67 times larger. That is the full span of the American map, from one state that rivals a midsize country to one smaller than many single cities.
These figures come from the U.S. Census Bureau's 2024 population estimates, the official count of how many people live in each state. The Bureau updates the number every year using births, deaths, and migration recorded since the 2020 Census. A higher rank here means only one thing: more people. It is not a measure of how well a state is run, how crowded it feels, or how fast it is growing.
The count matters well beyond bragging rights. The Census Bureau notes that these estimates are used in federal funding allocations and as the denominators for almost every per-capita statistic, from crime rates to school spending. When a state gains or loses people, its share of federal money and its political weight move with it.
Five States Hold More Than a Third of the Country
Population is not spread evenly across the map. Just five states, California, Texas, Florida, New York, and Pennsylvania, account for close to 37% of everyone living in the 50 states. The country's people are bunched into a handful of giants while most states hold a far smaller slice.
That lopsidedness shows up in the averages. The typical state has about 4.62 million residents, but the simple average lands much higher because a few enormous states pull it upward. Most states sit in the low millions; only a small group at the top breaks far above the pack.
Texas, the second-largest, holds 31.85 million people, and Florida follows at 23.84 million. Below the top tier, the drop-off is steep and steady. By the time the ranking reaches the smallest 10 states, each holds roughly a million people or fewer, less in some cases than a single large metro area inside California or Texas.
The Biggest State Is Nowhere Near the Most Crowded
Having the most people is not the same as being the most packed, and the gap between the two is wider than most readers expect. Population size and population density barely track each other across the states. The state with the most residents is not close to the densest, because density depends on land area as much as headcount.
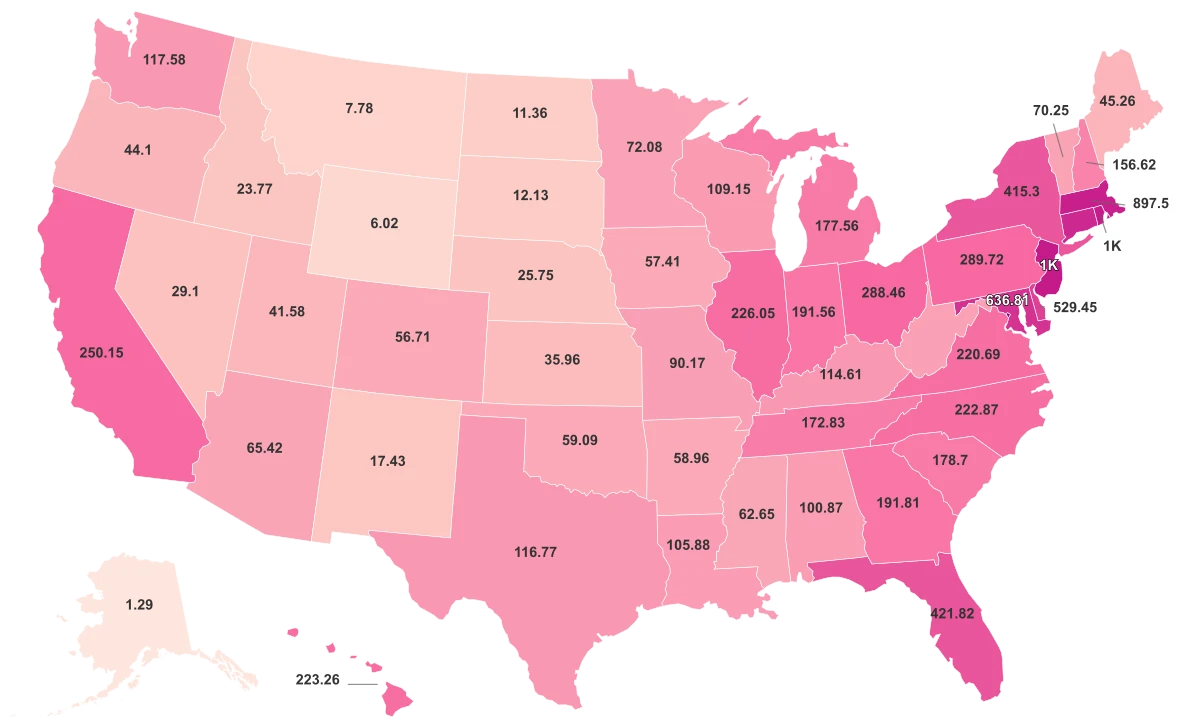
California is a clear example. It leads the country in people but sits only mid-pack in density, at about 250 residents per square mile. New Jersey, with a fraction of California's population, is more than five times denser at roughly 1,300 per square mile. The reason is geography: New Jersey squeezes its residents into about 7,354 square miles, while California spreads a much larger population across more than 150,000.
The Most Populous States Are Not the Most Crowded
Total population barely tracks with how densely packed a state is, because density depends on land area as much as headcount.
The extremes make the point. The District of Columbia, a small federal enclave rather than a state, packs in more than 11,000 people per square mile, a figure no state approaches. At the opposite end, Alaska holds barely more than one person per square mile. Crowding is a story about space, not just about how many people a place can claim.
The People Are Moving South, and the Coasts Are Emptying
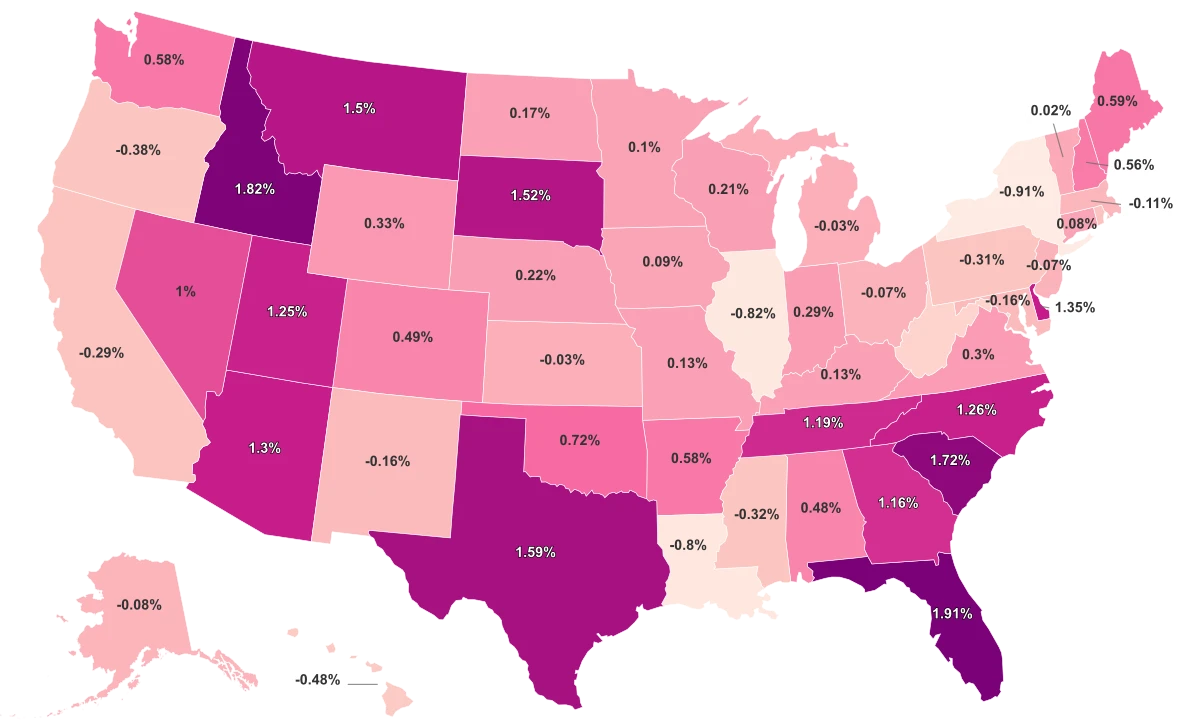
Where a state ranks today says little about which way it is heading. Some of the biggest states are now shrinking. New York, the fourth-largest state, posted the steepest decline of all, losing residents at about 0.91% a year. California and Illinois are losing people too, even as all three remain near the top of the table. Size is a snapshot of the past; growth is the signal of the future.
The growth is heading south and west. Florida is the fastest-growing state, adding people at about 1.91% a year, with Idaho and South Carolina close behind. By region, the South gains roughly 0.66% annually and the West about 0.53%, while the Northeast is flat to slightly negative. The map of who is gaining looks almost nothing like the map of who is biggest.
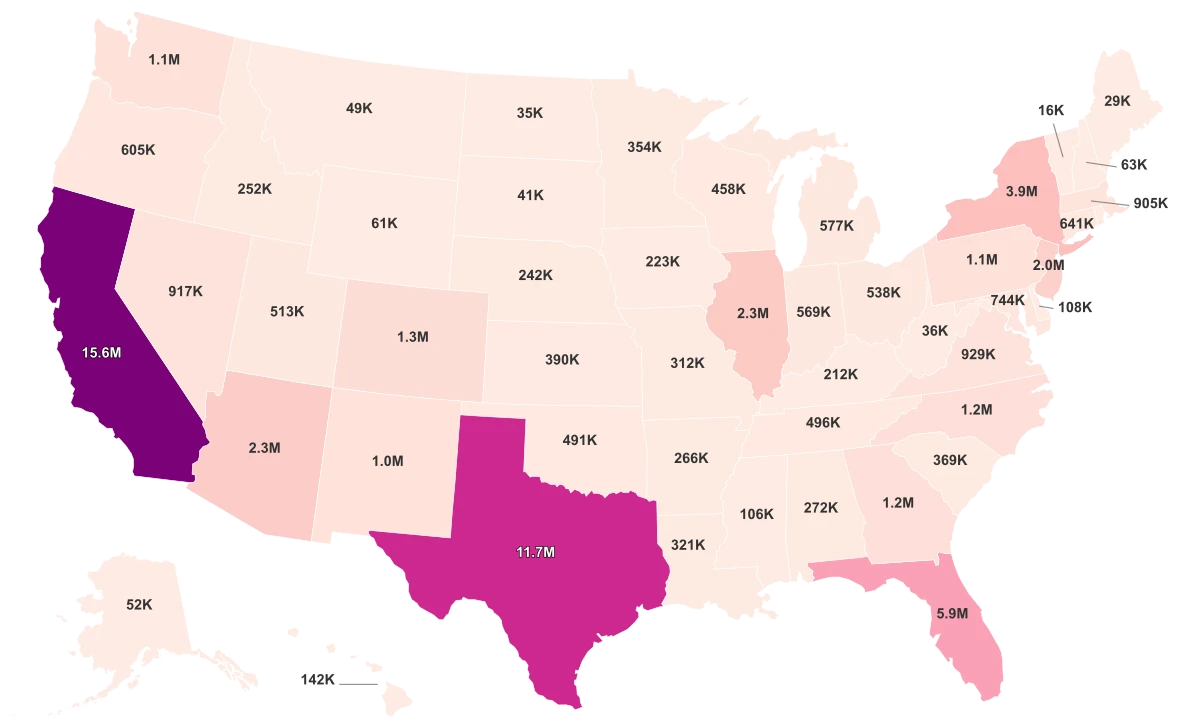
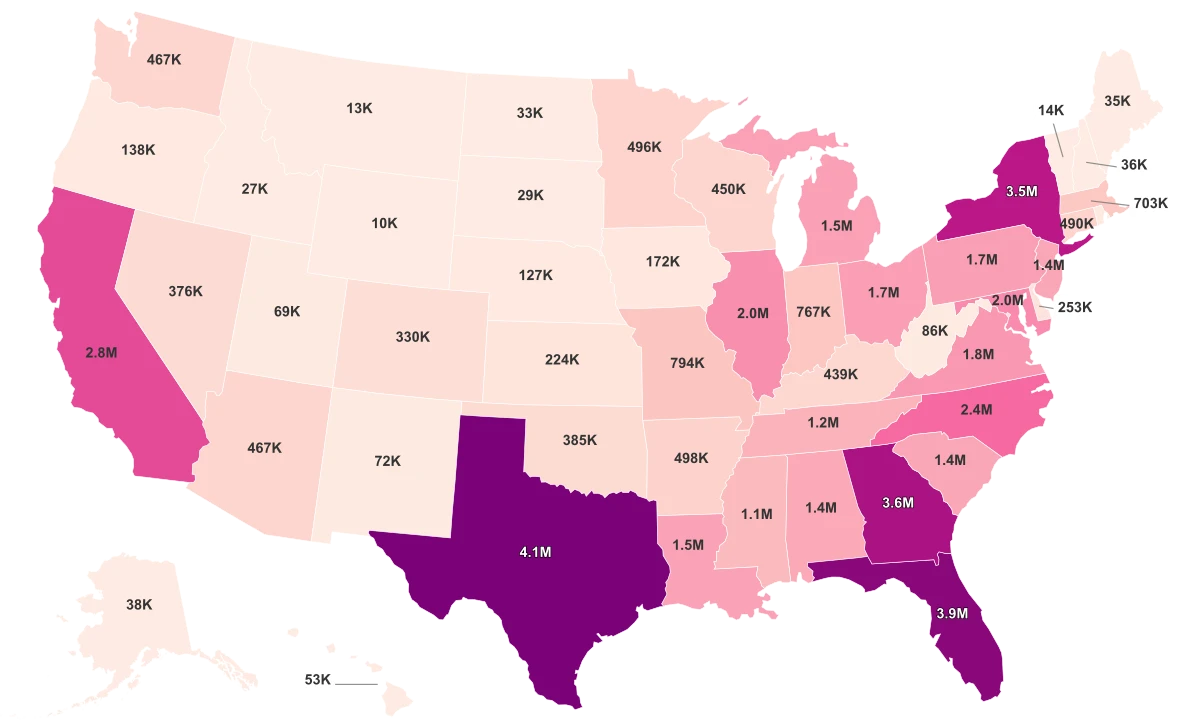
The Census Bureau's own breakdown explains why. The giant coastal states are losing residents to other states faster than anywhere else: California, New York, and Illinois posted the largest net domestic migration losses, and the South was the only region where more people moved in than out. What keeps the big states from shrinking faster is international migration, which the Bureau reports drove most of the nation's recent growth.
This is the quiet rebalancing underneath a ranking that looks stable. California, Texas, and Florida will sit at the top for years, but the people fueling the country's growth are increasingly settling in the Sun Belt, not the historic population centers of the Northeast.
Sources & Notes
Total number of people.
Number of people per square mile.