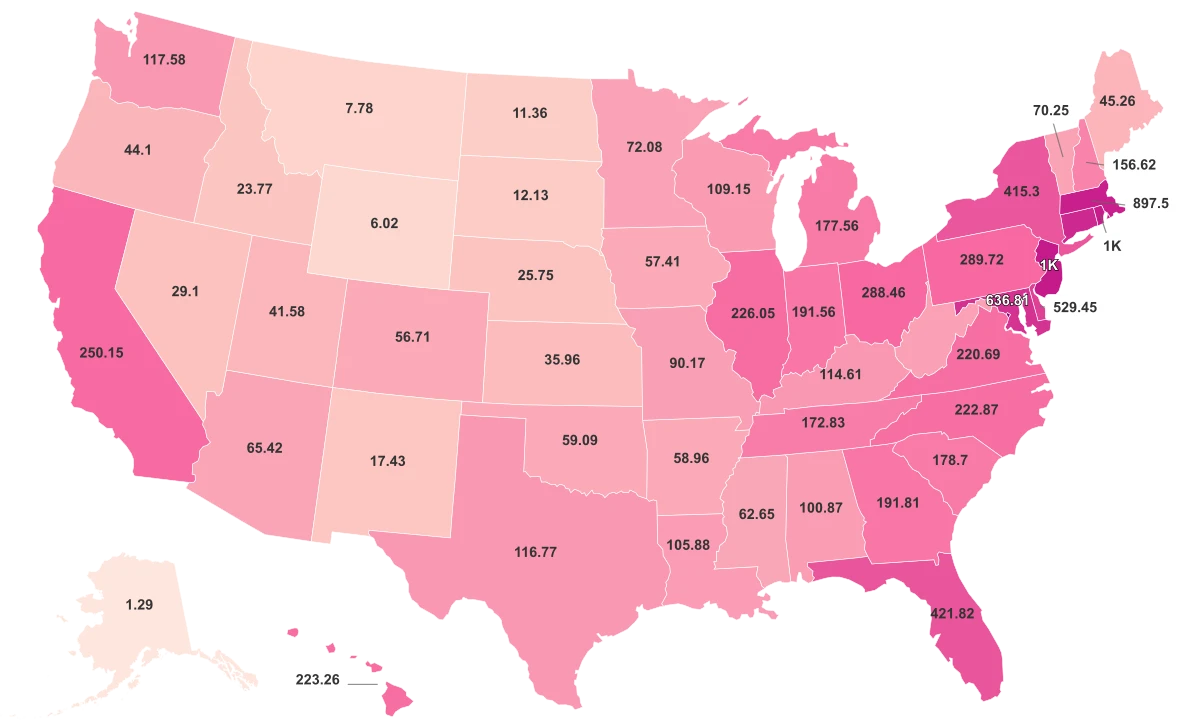
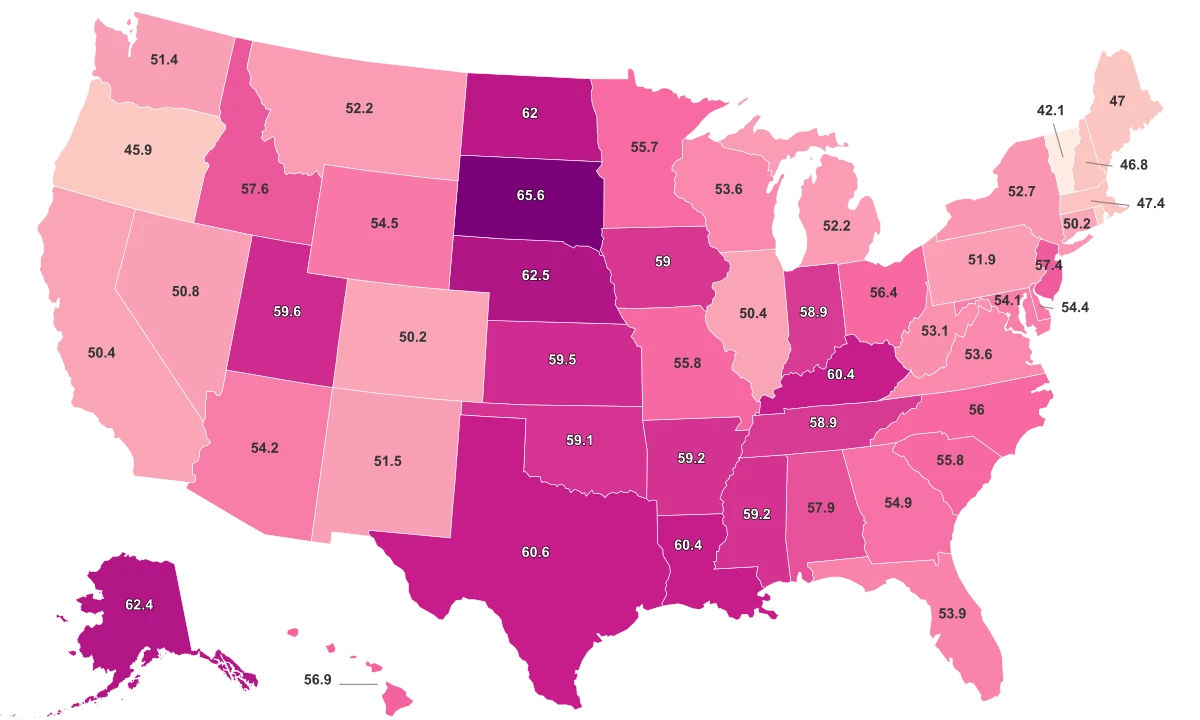
Population Density By State

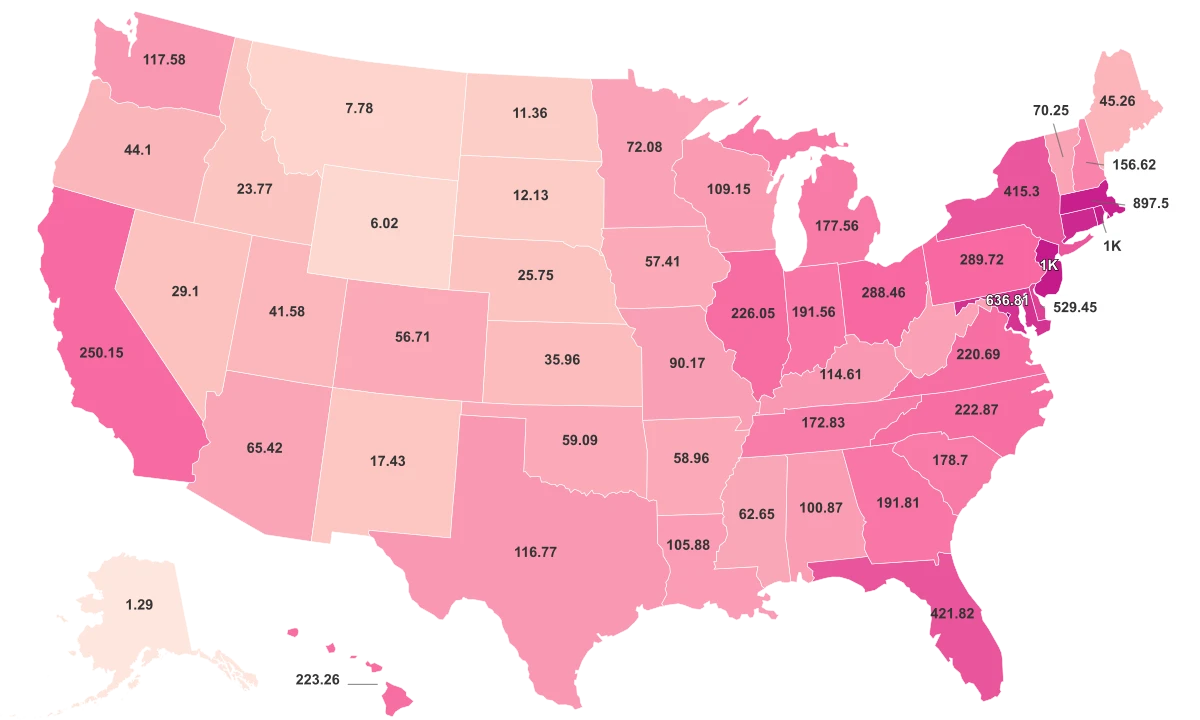
1 |  | District of Columbia | 11,131per mi² |
2 |  | New Jersey | 1,263.37per mi² |
3 |  | Rhode Island | 1,059.92per mi² |
4 |  | Massachusetts | 897.5per mi² |
5 |  | Connecticut | 747.35per mi² |
6 |  | Maryland | 636.81per mi² |
7 |  | Delaware | 529.45per mi² |
8 |  | Florida | 421.82per mi² |
9 |  | New York | 415.3per mi² |
10 |  | Pennsylvania | 289.72per mi² |
11 |  | Ohio | 288.46per mi² |
12 |  | California | 250.15per mi² |
13 |  | Illinois | 226.05per mi² |
14 |  | Hawaii | 223.26per mi² |
15 |  | North Carolina | 222.87per mi² |
16 |  | Virginia | 220.69per mi² |
17 |  | Georgia | 191.81per mi² |
18 |  | Indiana | 191.56per mi² |
19 |  | South Carolina | 178.7per mi² |
20 |  | Michigan | 177.56per mi² |
21 |  | Tennessee | 172.83per mi² |
22 |  | New Hampshire | 156.62per mi² |
23 |  | Washington | 117.58per mi² |
24 |  | Texas | 116.77per mi² |
25 |  | Kentucky | 114.61per mi² |
26 |  | Wisconsin | 109.15per mi² |
27 |  | Louisiana | 105.88per mi² |
28 |  | Alabama | 100.87per mi² |
29 |  | Missouri | 90.17per mi² |
30 |  | West Virginia | 73.64per mi² |
31 |  | Minnesota | 72.08per mi² |
32 |  | Vermont | 70.25per mi² |
33 |  | Arizona | 65.42per mi² |
34 |  | Mississippi | 62.65per mi² |
35 |  | Oklahoma | 59.09per mi² |
36 |  | Arkansas | 58.96per mi² |
37 |  | Iowa | 57.41per mi² |
38 |  | Colorado | 56.71per mi² |
39 |  | Maine | 45.26per mi² |
40 |  | Oregon | 44.1per mi² |
41 |  | Utah | 41.58per mi² |
42 |  | Kansas | 35.96per mi² |
43 |  | Nevada | 29.1per mi² |
44 |  | Nebraska | 25.75per mi² |
45 |  | Idaho | 23.77per mi² |
46 |  | New Mexico | 17.43per mi² |
47 |  | South Dakota | 12.13per mi² |
48 |  | North Dakota | 11.36per mi² |
49 |  | Montana | 7.78per mi² |
50 |  | Wyoming | 6.02per mi² |
51 |  | Alaska | 1.29per mi² |
Last updated June 25, 2026
Key Takeaways
- New Jersey is the densest state, with roughly 1,300 people per square mile.
- Alaska is the emptiest, at about 1.3 people per square mile.
- The District of Columbia holds around 11,100 people per square mile, but it is a federal district, not a state.
- Density tracks the price of a home far more closely than it tracks a state's total population.
All Metrics
| Region ↕ | Population Density 2023↕ | Population 2024↕ | Home Price 2025↕ |
|---|---|---|---|
| District of Columbia | 11.1K | ||
| New Jersey | 1.3K | ||
| Rhode Island | 1.1K | ||
| Massachusetts | |||
| Connecticut | 747.4 | ||
| Maryland | 636.8 | ||
| Delaware | 529.5 | ||
| Florida | 421.8 | ||
| New York | |||
| Pennsylvania | 289.7 | ||
| Ohio | 288.5 | ||
| California | 250.2 | ||
| Illinois | 226.1 | ||
| Hawaii | 223.3 | ||
| North Carolina | 222.9 | ||
| Virginia | 220.7 | ||
| Georgia | 191.8 | ||
| Indiana | 191.6 | ||
| South Carolina | |||
| Michigan | 177.6 | ||
| Tennessee | 172.8 | ||
| New Hampshire | 156.6 | ||
| Washington | 117.6 | ||
| Texas | 116.8 | ||
| Kentucky | 114.6 | ||
| Wisconsin | 109.2 | ||
| Louisiana | 105.9 | ||
| Alabama | 100.9 | ||
| Missouri | 90.2 | ||
| West Virginia | 73.6 | ||
| Minnesota | 72.1 | ||
| Vermont | 70.3 | ||
| Arizona | 65.4 | ||
| Mississippi | 62.7 | ||
| Oklahoma | 59.1 | ||
| Arkansas | 59.0 | ||
| Iowa | 57.4 | ||
| Colorado | 56.7 | ||
| Maine | 45.3 | ||
| Oregon | |||
| Utah | 41.6 | ||
| Kansas | 36.0 | ||
| Nevada | |||
| Nebraska | 25.8 | ||
| Idaho | 23.8 | ||
| New Mexico | 17.4 | ||
| South Dakota | 12.1 | ||
| North Dakota | 11.4 | ||
| Montana | 7.8 | ||
| Wyoming | 6.0 | ||
| Alaska | 1.3 |
Where Americans Actually Live Shoulder-to-Shoulder
Population density is a simple idea: take everyone who lives in a place and divide by the land they live on. The Census Bureau measures it as the number of people per square mile, with bodies of water left out. The figures here are Census-Bureau-derived for 2023, republished by Statista.
Among the 50 states, New Jersey is the most crowded, at about 1,300 people per square mile. Alaska sits at the opposite end, with roughly 1.3. A higher number simply means more people share each square mile of ground, not that a state is doing anything right or wrong.
One place towers over every state on the list, and it is not a state. The District of Columbia holds around 11,100 people per square mile, a 61-square-mile federal city that the Census itself lists alongside a territory, apart from the 50 states. Treat it as a benchmark at the far edge of the chart, not the winner of a state ranking. The densest actual state is New Jersey.
| Rank | State | People per square mile (2023) |
|---|---|---|
| 1 | New Jersey | 1,300 |
| 2 | Rhode Island | 1,100 |
| 3 | Massachusetts | 897.5 |
| 4 | Connecticut | 747.4 |
| 5 | Maryland | 636.8 |
| ... | ... | ... |
| 48 | Montana | 7.8 |
| 49 | Wyoming | 6.0 |
| 50 | Alaska | 1.3 |
Why Big States Aren't Crowded States
Ask someone to name the most crowded states and they will usually reach for the biggest ones. The data says that instinct is wrong. Across the states, how many people a state has tells you almost nothing about how tightly they are packed. The two barely move together, and the relationship is not statistically reliable.
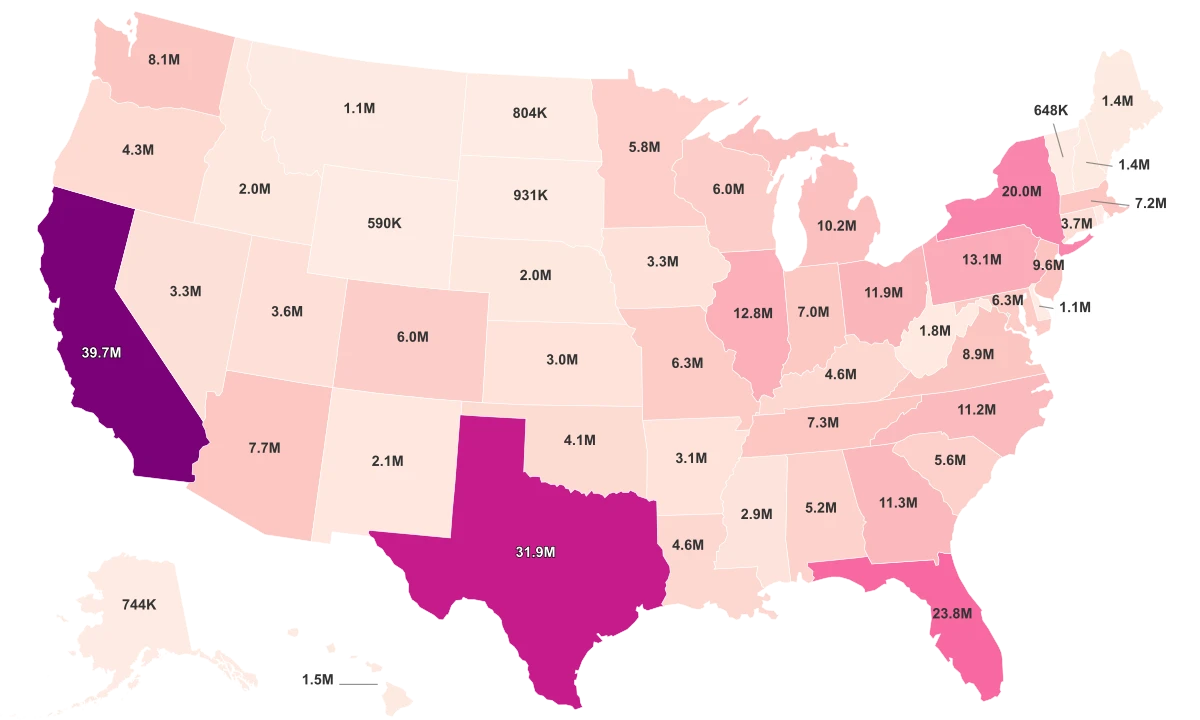
California is the clearest case. It has more residents than any other state, nearly 40 million of them, yet its density of about 250 people per square mile lands it in the middle of the pack. Texas tells the same story: second in population, with close to 32 million people, but only around 117 per square mile.
The reason is arithmetic. Density divides people by land, and California and Texas have enormous amounts of land to spread across.
The crowded states do the opposite. New Jersey, Rhode Island, and Massachusetts are small, and a modest population pressed into a small footprint produces a high number. A small denominator, not a big numerator, is what puts a state at the top.
A Thousandfold Gap, and an Average That Lies
The distance between the most and least crowded states is hard to overstate. New Jersey is roughly a thousand times denser than Alaska. Squeeze New Jersey's settlement pattern and you get a built-up corridor of suburbs and cities; stretch Alaska's and you get a few people scattered across a landmass larger than most countries. The Congressional Research Service notes that federal ownership of land is concentrated in Alaska and the western states, which leaves much of that ground unsettleable in the first place.
Because a handful of states sit so high, the plain average is a poor guide to normal life. The typical state, the one in the middle of the pack, holds about 109 people per square mile. The average comes out near 423, dragged upward by the dense Northeast and by the District of Columbia. Reach for the typical state, not the average, if you want a sense of what an ordinary square mile looks like.
The pattern is regional, and one region leads it clearly. The Northeast averages about 558 people per square mile, several times the Midwest's roughly 108. The West sits lower still, near 68. That Northeastern cluster is no accident: the geographer Jean Gottman, writing in 1961, gave the dense Boston-to-Washington seaboard a name, calling it a megalopolis, and the band of small, urbanized states he described still anchors the top of this ranking.
Crowding Has a Price Tag
If population does not explain density, something else does, and it is the one that shows up in a household budget. Across the states, denser places tend to be pricier places. The link between how crowded a state is and what a home costs there is real and reliable, and crowding accounts for roughly a third of the difference in home prices from one state to the next.
The crowded Northeastern states carry the higher price tags, and the empty interior states carry the lower ones. New Jersey, the densest state, runs well above the national middle on home prices. The thinly settled Plains and Mountain states, where land is plentiful, sit near the bottom. The relationship is not perfect, but unlike the broken link between population and density, this one holds up under the data.
The More Crowded the State, the Steeper the Price of a Home
Across all 50 states and DC, denser states command higher median home prices, the one relationship that survives once total population is set aside.
That makes crowding less an abstraction than a cost. Density is shorthand for competition over a fixed amount of buildable land, and where the land runs short, the price of putting a roof on it climbs. A reader scanning this map for the most crowded states is, without quite meaning to, also scanning for the most expensive ones.
Sources & Notes
Number of people per square mile.
Total number of people.
Median sale prices for single-family residential properties.