Safest Countries in the World

1— | Iceland | 1.095-0.017 (-1.5%) | |
2— | Ireland | 1.26-0.043 (-3.3%) | |
3▲1 | New Zealand | 1.282-0.041 (-3.1%) | |
4▲2 | Switzerland | 1.294-0.056 (-4.1%) | |
4▼1 | Austria | 1.294-0.019 (-1.4%) | |
6▼1 | Singapore | 1.357+0.018 (+1.3%) | |
7— | Portugal | 1.371-0.001 (-0.1%) | |
8— | Denmark | 1.393+0.011 (+0.8%) | |
9— | Slovenia | 1.409+0.014 (+1.0%) | |
10▲3 | Finland | 1.42-0.054 (-3.7%) | |
11▲1 | Czech Republic | 1.435-0.024 (-1.6%) | |
12▲5 | Japan | 1.44-0.085 (-5.6%) | |
13▼3 | Malaysia | 1.469+0.042 (+2.9%) | |
14▼3 | Canada | 1.491+0.042 (+2.9%) | |
14▲4 | Netherlands | 1.491-0.036 (-2.4%) | |
16— | Belgium | 1.492-0.018 (-1.2%) | |
17▼3 | Hungary | 1.5-0.002 (-0.1%) | |
18▲1 | Australia | 1.505-0.031 (-2.0%) | |
19▼4 | Croatia | 1.519+0.015 (+1.0%) | |
20— | Germany | 1.533-0.009 (-0.6%) | |
21— | Bhutan | 1.536-0.028 (-1.8%) | |
22▲8 | Latvia | 1.558-0.103 (-6.2%) | |
22▲9 | Lithuania | 1.558-0.114 (-6.8%) | |
24— | Estonia | 1.559-0.056 (-3.5%) | |
25▼2 | Spain | 1.578-0.019 (-1.2%) | |
26▼4 | Mauritius | 1.586+0.009 (+0.6%) | |
27▲2 | Qatar | 1.593-0.063 (-3.8%) | |
28▼1 | Slovakia | 1.609-0.025 (-1.5%) | |
29▼3 | Bulgaria | 1.61-0.019 (-1.2%) | |
30▲4 | United Kingdom | 1.634-0.069 (-4.1%) | |
31▼6 | Kuwait | 1.642+0.02 (+1.2%) | |
32▼4 | Norway | 1.644+0.006 (+0.4%) | |
33— | Italy | 1.662-0.03 (-1.8%) | |
34▲1 | Montenegro | 1.685-0.061 (-3.5%) | |
35▲4 | Sweden | 1.709-0.073 (-4.1%) | |
36▼4 | Poland | 1.713+0.035 (+2.1%) | |
37▲8 | Mongolia | 1.719-0.126 (-6.8%) | |
38▼2 | Romania | 1.721-0.034 (-1.9%) | |
38▲3 | Vietnam | 1.721-0.081 (-4.5%) | |
40▲3 | Taiwan | 1.73-0.088 (-4.8%) | |
41▲5 | South Korea | 1.736-0.112 (-6.1%) | |
42▼5 | Oman | 1.738-0.023 (-1.3%) | |
43▲7 | Botswana | 1.743-0.12 (-6.4%) | |
44▲7 | Timor Leste | 1.758-0.124 (-6.6%) | |
45▼5 | Greece | 1.764-0.029 (-1.6%) | |
46▲1 | Argentina | 1.768-0.087 (-4.7%) | |
47▲2 | Laos | 1.783-0.078 (-4.2%) | |
48▲4 | Uruguay | 1.784-0.109 (-5.8%) | |
49▼1 | Indonesia | 1.786-0.071 (-3.8%) | |
50▲12 | Namibia | 1.789-0.183 (-9.3%) | |
51▼13 | North Macedonia | 1.799+0.035 (+2.0%) | |
52▼10 | Albania | 1.812+0.003 (+0.2%) | |
52▲1 | United Arab Emirates | 1.812-0.085 (-4.5%) | |
54▲4 | Costa Rica | 1.843-0.107 (-5.5%) | |
55▲27 | Gambia | 1.855-0.224 (-11%) | |
56▲3 | Kazakhstan | 1.875-0.079 (-4.0%) | |
57▲9 | Sierra Leone | 1.887-0.106 (-5.3%) | |
58▲18 | Armenia | 1.893-0.159 (-7.7%) | |
59▼15 | Madagascar | 1.895+0.057 (+3.1%) | |
59▲2 | Bosnia and Herzegovina | 1.895-0.066 (-3.4%) | |
61▼6 | Ghana | 1.898-0.04 (-2.1%) | |
62▲2 | Chile | 1.899-0.079 (-4.0%) | |
63▼7 | Kosovo | 1.908-0.037 (-1.9%) | |
64▼7 | Zambia | 1.914-0.034 (-1.7%) | |
64▼10 | Serbia | 1.914-0.016 (-0.8%) | |
66▼3 | Moldova | 1.918-0.058 (-2.9%) | |
67▼7 | Uzbekistan | 1.926-0.031 (-1.6%) | |
68▲20 | Cyprus | 1.933-0.168 (-8.0%) | |
69▲15 | Senegal | 1.936-0.148 (-7.1%) | |
70▼1 | Liberia | 1.939-0.086 (-4.2%) | |
71▲8 | Malawi | 1.955-0.108 (-5.2%) | |
72▼5 | Jordan | 1.957-0.041 (-2.1%) | |
73▼8 | Tanzania | 1.965-0.022 (-1.1%) | |
74▲12 | France | 1.967-0.121 (-5.8%) | |
75▼2 | Paraguay | 1.981-0.063 (-3.1%) | |
76▼4 | Angola | 1.987-0.056 (-2.7%) | |
76▲4 | Nepal | 1.987-0.082 (-4.0%) | |
78▼1 | Kyrgyzstan | 1.988-0.065 (-3.2%) | |
79▼8 | Tajikistan | 1.996-0.039 (-1.9%) | |
79▲18 | Dominican Republic | 1.996-0.161 (-7.5%) | |
81▼8 | Tunisia | 1.998-0.046 (-2.3%) | |
82▲12 | Equatorial Guinea | 2.004-0.128 (-6.0%) | |
83▼15 | Bolivia | 2.005-0.004 (-0.2%) | |
84▲12 | Panama | 2.006-0.134 (-6.3%) | |
85▼7 | Morocco | 2.012-0.042 (-2.0%) | |
86▼11 | Thailand | 2.017-0.031 (-1.5%) | |
87▼17 | Cambodia | 2.019-0.009 (-0.4%) | |
87▼5 | Turkmenistan | 2.019-0.06 (-2.9%) | |
89▼2 | Trinidad and Tobago | 2.02-0.072 (-3.4%) | |
90▲12 | Saudi Arabia | 2.035-0.171 (-7.8%) | |
91▲1 | Rwanda | 2.036-0.084 (-4.0%) | |
92▼2 | Algeria | 2.042-0.068 (-3.2%) | |
93▼2 | Jamaica | 2.047-0.072 (-3.4%) | |
94▲15 | Ivory Coast | 2.066-0.189 (-8.4%) | |
95▲11 | Azerbaijan | 2.067-0.181 (-8.1%) | |
96▲3 | Peru | 2.073-0.106 (-4.9%) | |
97▲3 | Sri Lanka | 2.075-0.12 (-5.5%) | |
98▼10 | China | 2.093-0.008 (-0.4%) | |
99▲4 | Eswatini | 2.094-0.115 (-5.2%) | |
100▼19 | Bahrain | 2.099+0.027 (+1.3%) | |
101▼16 | Guinea Bissau | 2.112+0.027 (+1.3%) | |
102▼4 | Cuba | 2.123-0.037 (-1.7%) | |
103▲7 | Republic of the Congo | 2.132-0.129 (-5.7%) | |
104▲3 | El Salvador | 2.136-0.114 (-5.1%) | |
105▼1 | Philippines | 2.148-0.062 (-2.8%) | |
106▲5 | Guyana | 2.149-0.137 (-6.0%) | |
107▼2 | Egypt | 2.157-0.055 (-2.5%) | |
108▲9 | Guatemala | 2.174-0.158 (-6.8%) | |
109▼9 | Georgia | 2.185-0.01 (-0.5%) | |
110▼15 | Mauritania | 2.204+0.068 (+3.2%) | |
111▲2 | Nicaragua | 2.207-0.088 (-3.8%) | |
112▲2 | Benin | 2.211-0.095 (-4.1%) | |
113▲13 | Uganda | 2.217-0.26 (-10%) | |
114▲7 | Zimbabwe | 2.223-0.173 (-7.2%) | |
115▲1 | India | 2.229-0.09 (-3.9%) | |
116▼1 | Papua New Guinea | 2.23-0.085 (-3.7%) | |
117▲1 | Gabon | 2.238-0.134 (-5.6%) | |
118▲6 | Guinea | 2.253-0.17 (-7.0%) | |
119▲6 | Lesotho | 2.267-0.194 (-7.9%) | |
119▼7 | Belarus | 2.267-0.024 (-1.0%) | |
121▼14 | Mozambique | 2.273+0.023 (+1.0%) | |
122▼3 | Djibouti | 2.276-0.098 (-4.1%) | |
123▼30 | Bangladesh | 2.318+0.192 (+9.0%) | |
124▲3 | South Africa | 2.347-0.16 (-6.4%) | |
124▼1 | Honduras | 2.347-0.068 (-2.8%) | |
126▼6 | Togo | 2.381 | |
127▼5 | Kenya | 2.392-0.017 (-0.7%) | |
128▲4 | United States | 2.443-0.179 (-6.8%) | |
129▲1 | Ecuador | 2.459-0.113 (-4.4%) | |
130▲1 | Brazil | 2.472-0.117 (-4.5%) | |
131▼3 | Libya | 2.478-0.05 (-2.0%) | |
132▲4 | Eritrea | 2.542-0.206 (-7.5%) | |
133▼4 | Burundi | 2.574+0.007 (+0.3%) | |
134▲1 | Chad | 2.593-0.111 (-4.1%) | |
135▲3 | Mexico | 2.636-0.142 (-5.1%) | |
136▼2 | Lebanon | 2.674-0.019 (-0.7%) | |
137— | Cameroon | 2.683-0.09 (-3.2%) | |
138▲6 | Ethiopia | 2.688-0.157 (-5.5%) | |
139▲3 | Venezuela | 2.692-0.129 (-4.6%) | |
140▲6 | Colombia | 2.695-0.192 (-6.7%) | |
141▲2 | Haiti | 2.731-0.096 (-3.4%) | |
142▼9 | Iran | 2.75+0.068 (+2.5%) | |
143▼2 | Niger | 2.759-0.033 (-1.2%) | |
144▼4 | Pakistan | 2.797+0.014 (+0.5%) | |
145— | Palestine | 2.811-0.061 (-2.1%) | |
146▼7 | Turkey | 2.852+0.072 (+2.6%) | |
147▲4 | Iraq | 2.862-0.183 (-6.0%) | |
148▼1 | Nigeria | 2.869-0.038 (-1.3%) | |
149▲3 | North Korea | 2.911-0.144 (-4.7%) | |
150— | Central African Republic | 2.912-0.097 (-3.2%) | |
151▲2 | Somalia | 2.983-0.108 (-3.5%) | |
152▼3 | Burkina Faso | 3.016+0.047 (+1.6%) | |
153▼5 | Myanmar | 3.045+0.102 (+3.5%) | |
154— | Mali | 3.061-0.034 (-1.1%) | |
155— | Israel | 3.108-0.007 (-0.2%) | |
156▲5 | South Sudan | 3.117-0.207 (-6.2%) | |
157▼1 | Syria | 3.184+0.011 (+0.3%) | |
158▲2 | Afghanistan | 3.229-0.065 (-2.0%) | |
159▲4 | Yemen | 3.262-0.135 (-4.0%) | |
160▼2 | DR Congo | 3.292+0.028 (+0.9%) | |
161▲1 | Sudan | 3.323-0.004 (-0.1%) | |
162▼3 | Ukraine | 3.434+0.154 (+4.7%) | |
163▼6 | Russia | 3.441+0.192 (+5.9%) |
Last updated February 28, 2026
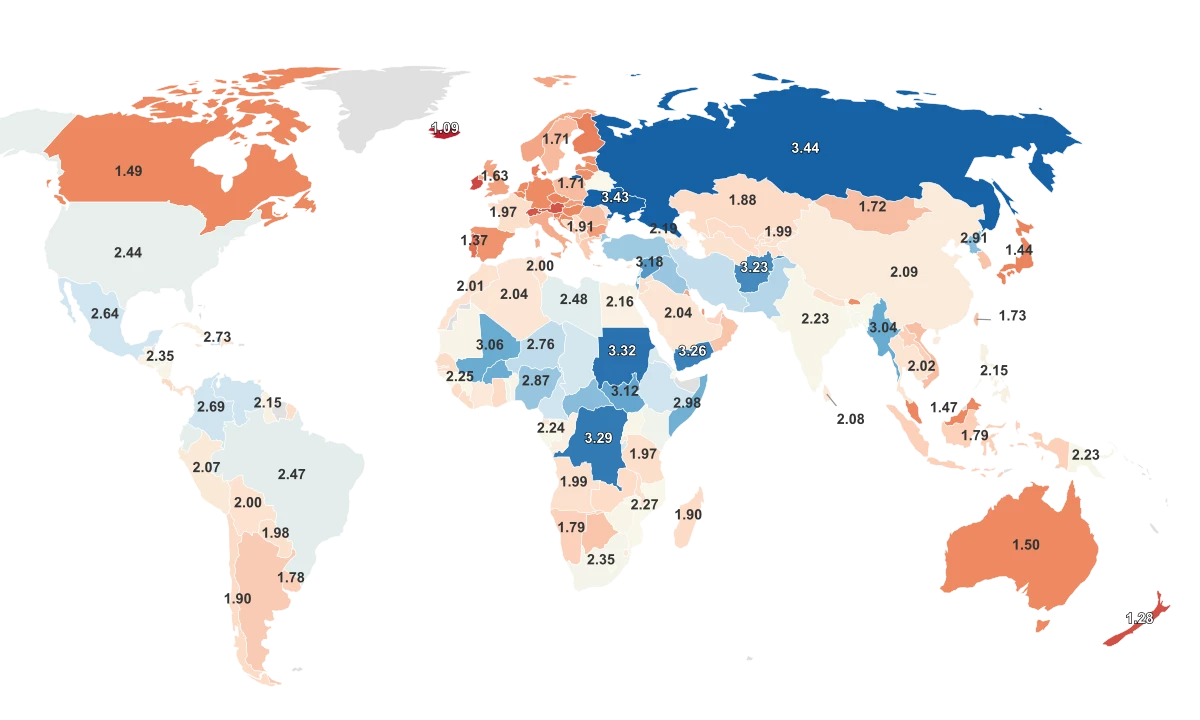
Safety Around the Globe
In our interconnected world, safety and security are central to our wellbeing and peace of mind, whether we're at home, at work, or on vacation. Global peace is a complex construct that hinges on various factors, including crime rates, political stability, quality of healthcare, and even the effectiveness of the country's response to global crises like pandemics.
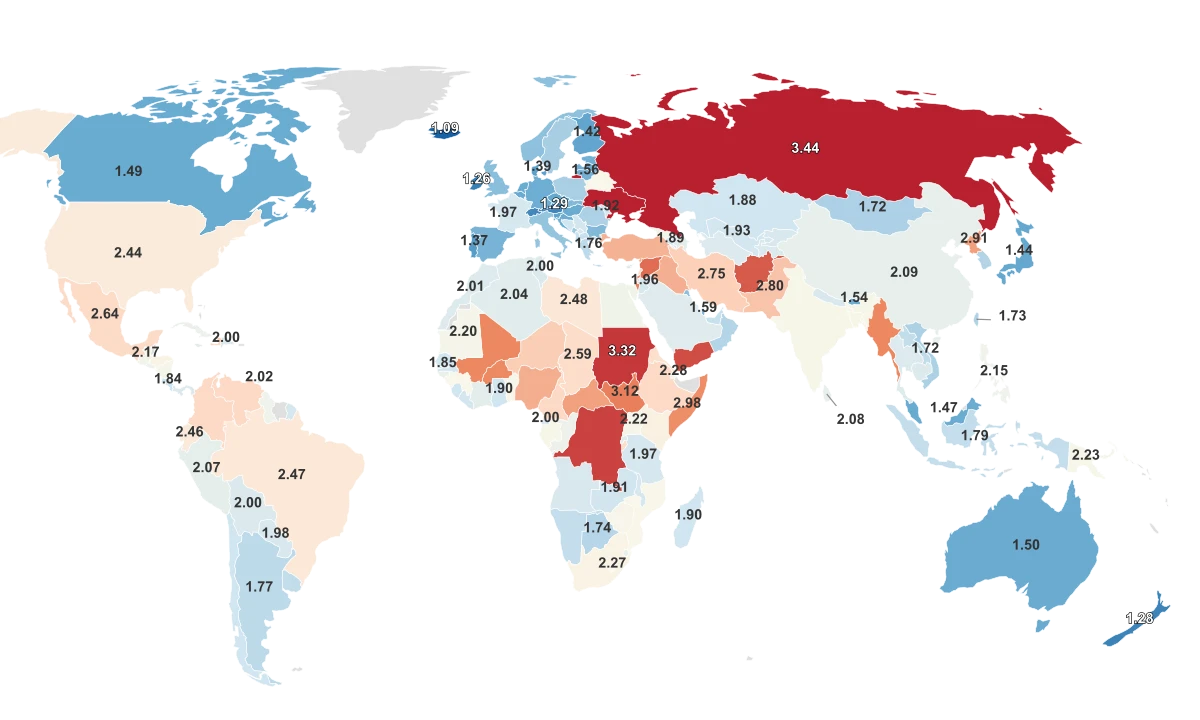
Every year, the Global Peace Index (GPI) is released by the Institute for Economics and Peace (IEP), providing a comprehensive analysis of the world's safest countries. The GPI uses 23 qualitative and quantitative indicators grouped into three broad themes: the level of Societal Safety and Security, the extent of Ongoing Domestic and International Conflict, and the degree of Militarization. This ranking system helps us understand how nations around the world compare in terms of safety.
Key findings from the data include:
- The Global Peace Index (GPI) 2022 observed a slight deterioration in global peacefulness by 0.3%, marking the eleventh decrease in peacefulness in the last fourteen years.
- Iceland maintained its position as the world's most peaceful country since 2008, followed by New Zealand, Ireland, Denmark, and Austria. Afghanistan remained the least peaceful country for the fifth consecutive year.
- The largest regional improvements in peacefulness occurred in South Asia and the Middle East and North Africa (MENA) region, driven by reductions in deaths from internal conflicts and improvements in military expenditure and terrorism impact.
- The conflict between Russia and Ukraine led to a significant deterioration in peacefulness in the Russia and Eurasia region, adversely impacting global peacefulness, and causing repercussions beyond the region.
- The economic impact of violence on the global economy in 2021 was $16.5 trillion in purchasing power parity (PPP) terms, with the countries most affected by violence having the average economic impact of violence equivalent to 34% of GDP.
All Metrics
10 Safest Countries in the World
Iceland leads the pack with an impressive GPI score of 1.107. Not only is Iceland recognized for its unique geographical features, but it has maintained its status as the safest country worldwide since 2008.
Following closely, New Zealand scores 1.269, claiming the second position. Known for its tranquility and nature-oriented quality of life, New Zealand promotes peaceful living conditions.
The third safest country is Ireland, with a GPI score of 1.288. Its citizens enjoy high safety, promoting a peaceful and calm environment that attracts both tourists and immigrants.
Documented as the fourth safest country, Denmark has a GPI score 1.296. Thanks to its well-functioning public system and societal security, the country has consistently ranked high in safety.
Austria stands fifth in line with a GPI score of 1.3, mainly due to its socially secured infrastructure and low crime rate.
Moving down the list, we have Portugal and Slovenia, ranking sixth and seventh with GPI scores of 1.301 and 1.316, respectively. These countries have committed to maintaining peace, safety, and security among their respective populations.
Next in line, the Czech Republic and Singapore stand at eighth and ninth positions, with GPI scores of 1.318 and 1.326. These nations have shown commendable resilience in maintaining peace and safety, notably amidst global challenges.
Finally, Japan, with a GPI score of 1.336, completes the list of the top ten safest countries in the world. Despite being one of the world's most populous countries, Japan's societal security measures ensure peace and safety for its residents.
10 Safest Countries and their GPI scores:
- Iceland - 1.107
- New Zealand - 1.269
- Ireland - 1.288
- Denmark - 1.296
- Austria - 1.3
- Portugal - 1.301
- Slovenia - 1.316
- Czech Republic - 1.318
- Singapore - 1.326
- Japan - 1.336
Frequently Asked Questions
Sources & Notes
Measure of peace and safety conditions where lower values indicate greater peacefulness.
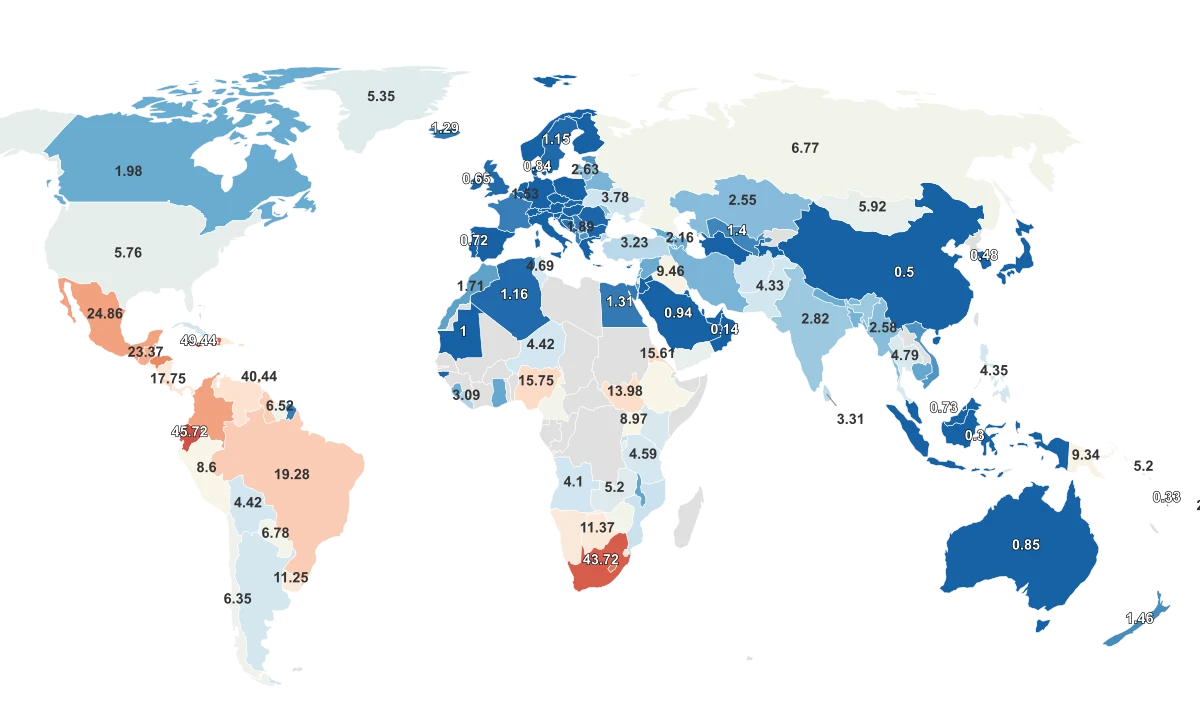
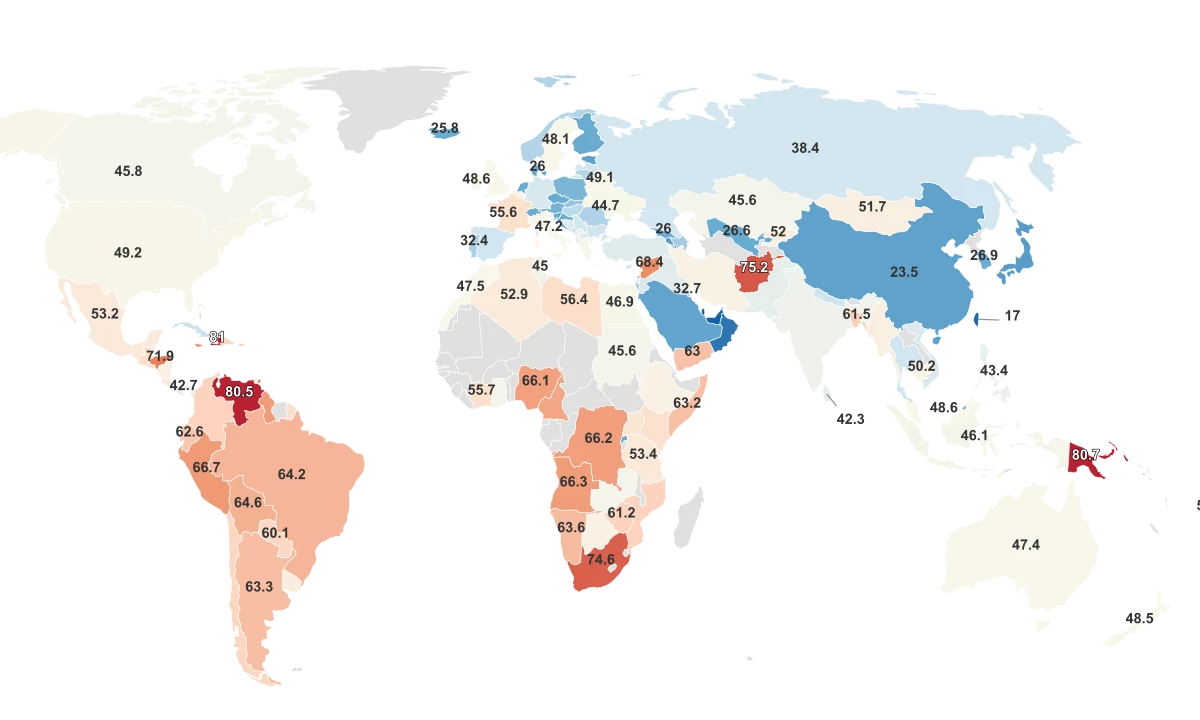
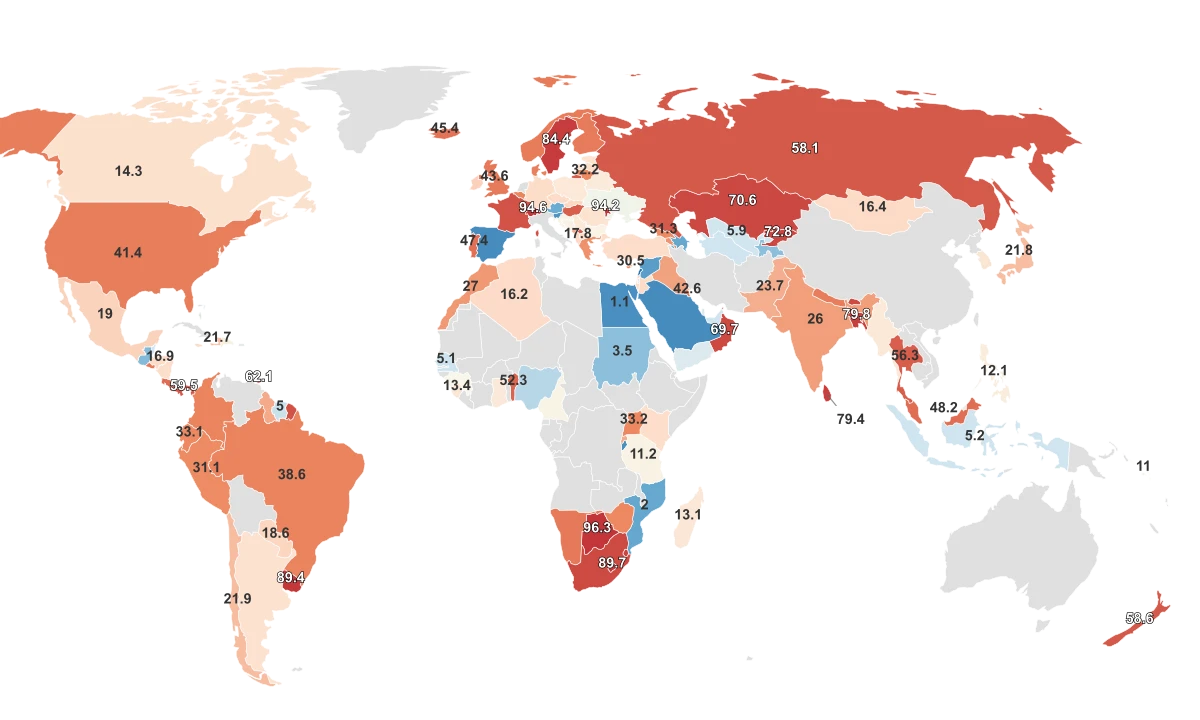
Reflects perceived levels of crime, based on types and frequency of crimes.
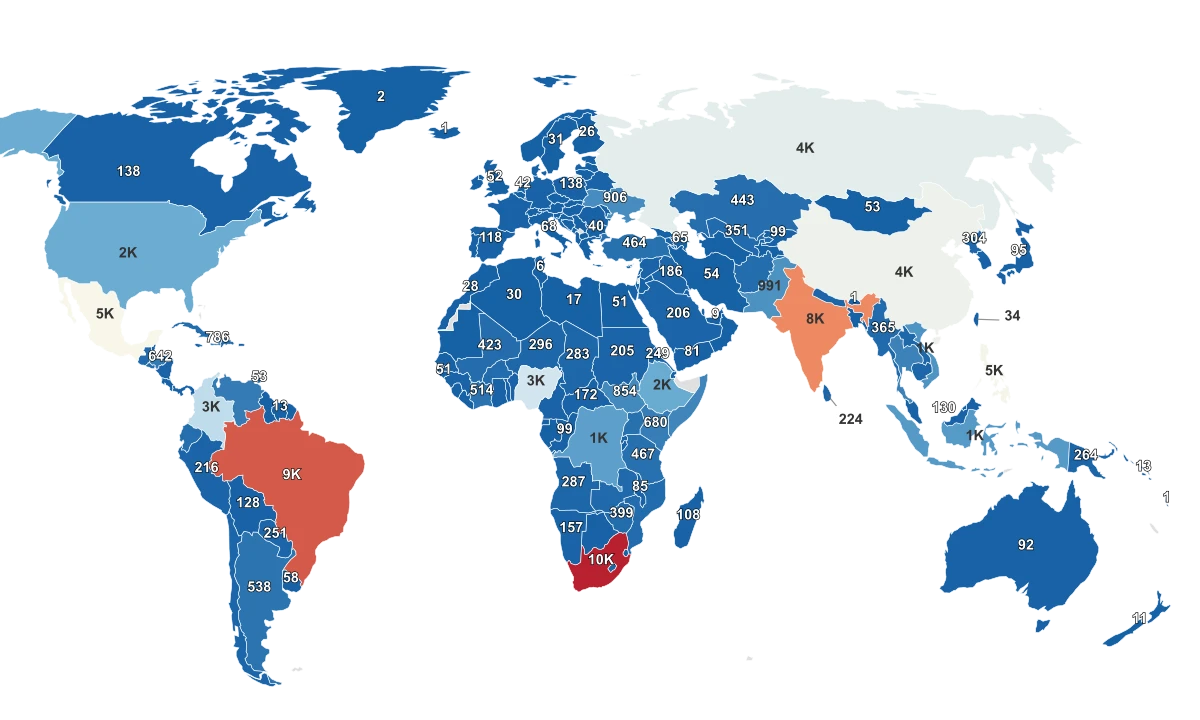
Rate per 100,000 people.
Editorial Note: Due to variations in international reporting infrastructure, this dataset reflects the most recent reporting year available for each respective country provided by the UNODC.