Gun Ownership By Country

1 | United States | 120.5per 100 | |
2 | Yemen | 52.8per 100 | |
3 | New Caledonia | 42.5per 100 | |
4 | Montenegro | 39.1per 100 | |
4 | Serbia | 39.1per 100 | |
6 | Canada | 34.7per 100 | |
6 | Uruguay | 34.7per 100 | |
8 | Cyprus | 34per 100 | |
9 | Finland | 32.4per 100 | |
10 | Lebanon | 31.9per 100 | |
11 | Iceland | 31.7per 100 | |
12 | Bosnia and Herzegovina | 31.2per 100 | |
13 | Austria | 30per 100 | |
14 | North Macedonia | 29.8per 100 | |
15 | Norway | 28.8per 100 | |
15 | Liechtenstein | 28.8per 100 | |
17 | Malta | 28.3per 100 | |
18 | Switzerland | 27.6per 100 | |
19 | New Zealand | 26.3per 100 | |
20 | Sweden | 23.1per 100 | |
21 | Pakistan | 22.3per 100 | |
21 | Greenland | 22.3per 100 | |
23 | Portugal | 21.3per 100 | |
24 | Iraq | 19.6per 100 | |
24 | Monaco | 19.6per 100 | |
24 | French Guiana | 19.6per 100 | |
24 | France | 19.6per 100 | |
24 | Germany | 19.6per 100 | |
24 | Reunion | 19.6per 100 | |
30 | Luxembourg | 18.9per 100 | |
31 | Bahamas | 18.8per 100 | |
32 | Jordan | 18.7per 100 | |
33 | Venezuela | 18.5per 100 | |
34 | Greece | 17.6per 100 | |
35 | Kuwait | 16.7per 100 | |
35 | Paraguay | 16.7per 100 | |
35 | Oman | 16.7per 100 | |
35 | Saudi Arabia | 16.7per 100 | |
35 | United Arab Emirates | 16.7per 100 | |
35 | Qatar | 16.7per 100 | |
41 | Turkey | 16.5per 100 | |
42 | Suriname | 15.9per 100 | |
43 | Guyana | 15.8per 100 | |
44 | Slovenia | 15.6per 100 | |
45 | Namibia | 15.4per 100 | |
46 | Thailand | 15.1per 100 | |
47 | Australia | 14.5per 100 | |
48 | Italy | 14.4per 100 | |
48 | San Marino | 14.4per 100 | |
50 | Andorra | 14.1per 100 | |
50 | Honduras | 14.1per 100 | |
52 | Croatia | 13.7per 100 | |
53 | Lithuania | 13.6per 100 | |
54 | Libya | 13.3per 100 | |
55 | Mexico | 12.9per 100 | |
56 | Bahrain | 12.8per 100 | |
57 | Belgium | 12.7per 100 | |
58 | Turkey | 12.5per 100 | |
58 | Czech Republic | 12.5per 100 | |
58 | Equatorial Guinea | 12.5per 100 | |
61 | Somalia | 12.4per 100 | |
62 | Russia | 12.3per 100 | |
63 | Chile | 12.1per 100 | |
63 | Guatemala | 12.1per 100 | |
65 | Albania | 12per 100 | |
65 | El Salvador | 12per 100 | |
67 | Guam | 11.5per 100 | |
68 | Angola | 11.2per 100 | |
69 | Panama | 10.8per 100 | |
70 | Latvia | 10.5per 100 | |
70 | Hungary | 10.5per 100 | |
72 | Samoa | 10.1per 100 | |
72 | Colombia | 10.1per 100 | |
72 | Georgia | 10.1per 100 | |
75 | Costa Rica | 10per 100 | |
75 | Belize | 10per 100 | |
77 | Denmark | 9.9per 100 | |
77 | Ukraine | 9.9per 100 | |
79 | South Africa | 9.7per 100 | |
80 | South Sudan | 9.6per 100 | |
81 | Cayman Islands | 9.2per 100 | |
82 | Jamaica | 8.8per 100 | |
83 | Martinique | 8.5per 100 | |
83 | Guadeloupe | 8.5per 100 | |
83 | Saint Martin | 8.5per 100 | |
86 | Bulgaria | 8.4per 100 | |
87 | Mauritius | 8.3per 100 | |
87 | Brazil | 8.3per 100 | |
89 | Syria | 8.2per 100 | |
90 | Tonga | 8per 100 | |
90 | Ghana | 8per 100 | |
92 | Mongolia | 7.9per 100 | |
93 | Spain | 7.5per 100 | |
94 | Argentina | 7.4per 100 | |
94 | Dominican Republic | 7.4per 100 | |
96 | Iran | 7.3per 100 | |
97 | Ireland | 7.2per 100 | |
98 | Israel | 6.7per 100 | |
99 | Sudan | 6.6per 100 | |
100 | Slovakia | 6.5per 100 | |
100 | Gambia | 6.5per 100 | |
102 | Maldives | 6.2per 100 | |
102 | Dominica | 6.2per 100 | |
104 | Belarus | 6.1per 100 | |
104 | Armenia | 6.1per 100 | |
106 | Cape Verde | 5.7per 100 | |
107 | Montserrat | 5.4per 100 | |
107 | Antigua and Barbuda | 5.4per 100 | |
109 | India | 5.3per 100 | |
110 | Nicaragua | 5.2per 100 | |
111 | United Kingdom | 5.1per 100 | |
112 | Estonia | 5per 100 | |
113 | Morocco | 4.8per 100 | |
113 | Lesotho | 4.8per 100 | |
115 | Bermuda | 4.6per 100 | |
115 | Grenada | 4.6per 100 | |
117 | Cambodia | 4.5per 100 | |
117 | Mozambique | 4.5per 100 | |
119 | Ivory Coast | 4.4per 100 | |
120 | Gibraltar | 4.1per 100 | |
120 | Egypt | 4.1per 100 | |
120 | Seychelles | 4.1per 100 | |
120 | Botswana | 4.1per 100 | |
124 | Vanuatu | 3.9per 100 | |
125 | China | 3.6per 100 | |
125 | Azerbaijan | 3.6per 100 | |
125 | Macau | 3.6per 100 | |
125 | Philippines | 3.6per 100 | |
125 | Hong Kong | 3.6per 100 | |
130 | Barbados | 3.5per 100 | |
131 | Saint Kitts and Nevis | 3.4per 100 | |
131 | Saint Lucia | 3.4per 100 | |
131 | Gabon | 3.4per 100 | |
131 | Sao Tome and Principe | 3.4per 100 | |
131 | Saint Vincent and the Grenadines | 3.4per 100 | |
136 | Turks and Caicos Islands | 3.3per 100 | |
137 | Trinidad and Tobago | 3.2per 100 | |
137 | Nigeria | 3.2per 100 | |
139 | Djibouti | 3.1per 100 | |
140 | Moldova | 3per 100 | |
140 | Laos | 3per 100 | |
142 | Zimbabwe | 2.8per 100 | |
142 | Kazakhstan | 2.8per 100 | |
142 | Kyrgyzstan | 2.8per 100 | |
142 | Mauritania | 2.8per 100 | |
146 | Curacao | 2.6per 100 | |
146 | Romania | 2.6per 100 | |
146 | Haiti | 2.6per 100 | |
146 | Northern Mariana Islands | 2.6per 100 | |
146 | Aruba | 2.6per 100 | |
146 | Netherlands | 2.6per 100 | |
152 | French Polynesia | 2.5per 100 | |
152 | Poland | 2.5per 100 | |
154 | Ecuador | 2.4per 100 | |
154 | Republic of the Congo | 2.4per 100 | |
154 | Sri Lanka | 2.4per 100 | |
157 | Liberia | 2.1per 100 | |
157 | Algeria | 2.1per 100 | |
157 | Cuba | 2.1per 100 | |
160 | Senegal | 2per 100 | |
160 | Peru | 2per 100 | |
160 | Burundi | 2per 100 | |
160 | Bolivia | 2per 100 | |
164 | Central African Republic | 1.8per 100 | |
165 | Myanmar | 1.6per 100 | |
165 | Vietnam | 1.6per 100 | |
167 | Comoros | 1.5per 100 | |
167 | Kenya | 1.5per 100 | |
167 | Guinea Bissau | 1.5per 100 | |
167 | Nepal | 1.5per 100 | |
171 | Brunei | 1.4per 100 | |
172 | Tuvalu | 1.2per 100 | |
172 | DR Congo | 1.2per 100 | |
174 | Mali | 1.1per 100 | |
174 | Tunisia | 1.1per 100 | |
174 | Palestine | 1.1per 100 | |
177 | Chad | 1per 100 | |
177 | Papua New Guinea | 1per 100 | |
177 | Guinea | 1per 100 | |
180 | Zambia | 0.9per 100 | |
180 | Burkina Faso | 0.9per 100 | |
182 | Bhutan | 0.8per 100 | |
182 | Tanzania | 0.8per 100 | |
182 | British Virgin Islands | 0.8per 100 | |
182 | Uganda | 0.8per 100 | |
182 | Kiribati | 0.8per 100 | |
182 | Togo | 0.8per 100 | |
188 | Micronesia | 0.7per 100 | |
188 | Malaysia | 0.7per 100 | |
188 | Madagascar | 0.7per 100 | |
188 | American Samoa | 0.7per 100 | |
192 | Marshall Islands | 0.5per 100 | |
192 | Fiji | 0.5per 100 | |
192 | Sierra Leone | 0.5per 100 | |
192 | Rwanda | 0.5per 100 | |
192 | Niger | 0.5per 100 | |
192 | Palau | 0.5per 100 | |
198 | Tajikistan | 0.4per 100 | |
198 | Bangladesh | 0.4per 100 | |
198 | Eritrea | 0.4per 100 | |
198 | Uzbekistan | 0.4per 100 | |
198 | Turkmenistan | 0.4per 100 | |
198 | Ethiopia | 0.4per 100 | |
204 | Singapore | 0.3per 100 | |
204 | Benin | 0.3per 100 | |
204 | Japan | 0.3per 100 | |
204 | Malawi | 0.3per 100 | |
204 | North Korea | 0.3per 100 | |
204 | Timor Leste | 0.3per 100 | |
210 | South Korea | 0.2per 100 | |
210 | Solomon Islands | 0.2per 100 |
Last updated February 28, 2026
Gauging Global Gun Ownership
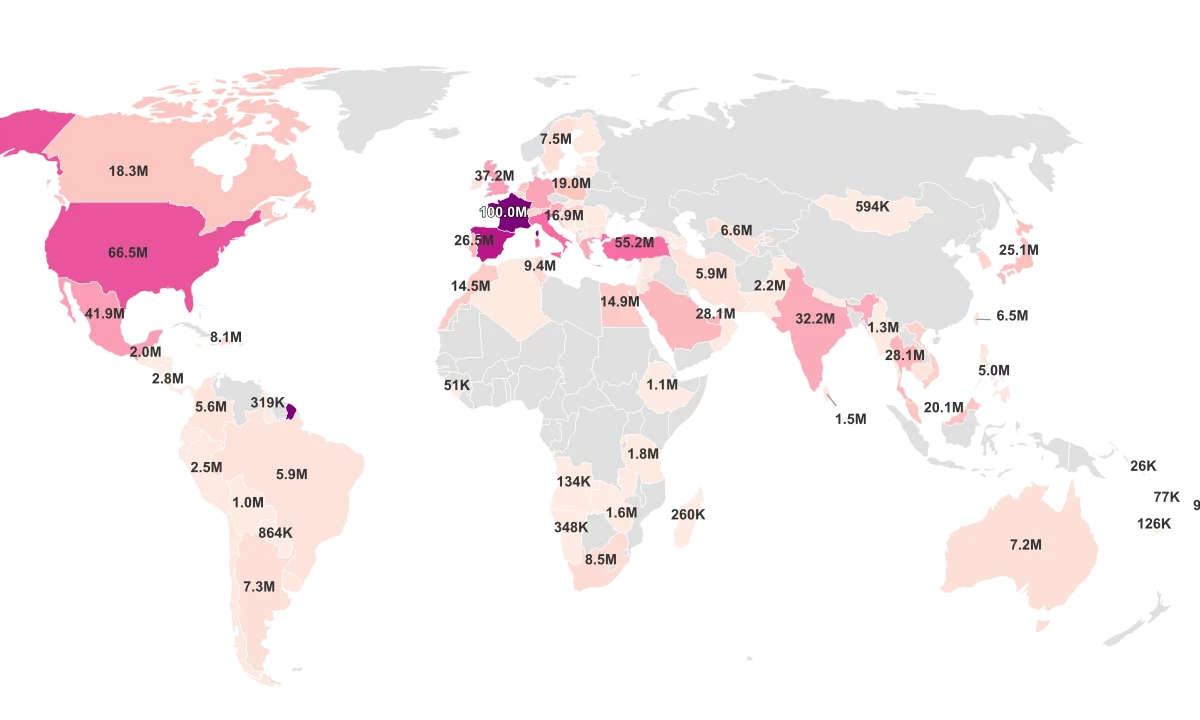
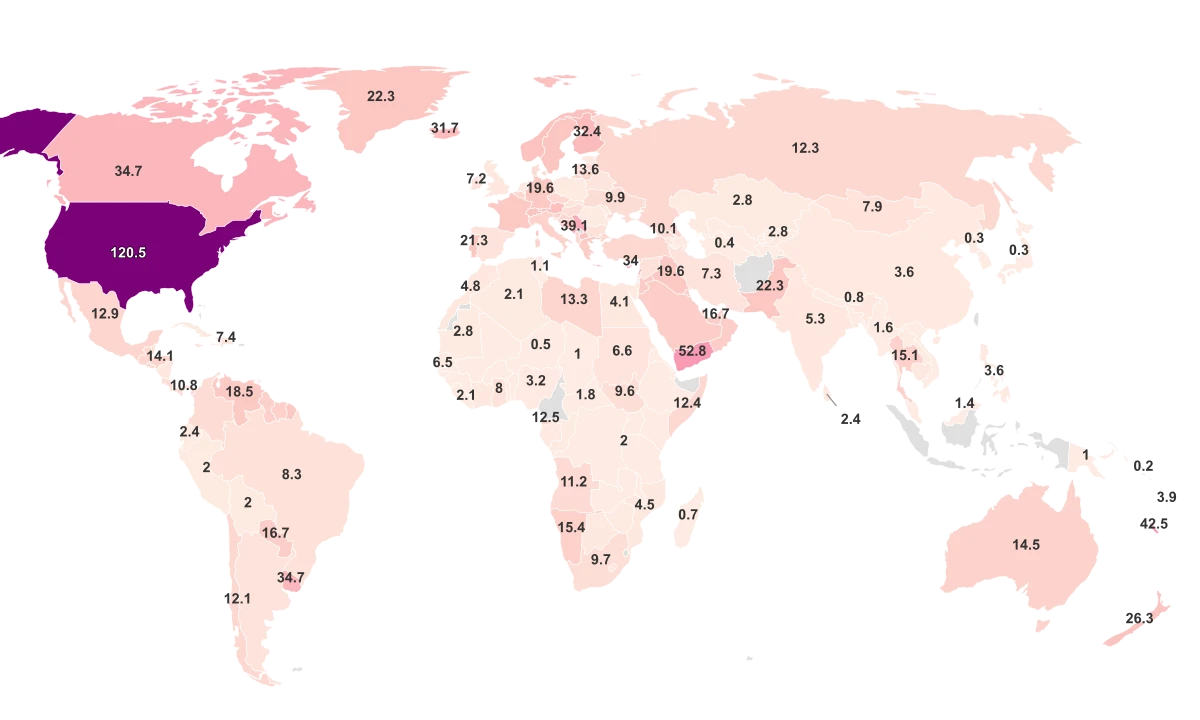
Gun ownership is often a deeply personal choice, whether grounded in self-defense, hunting, sport shooting, or simply exercising a right. However, it also contributes significantly to each country's social and political fabric, shaping cultures and influencing policies. An examination of international gun ownership rates reveals striking differences among countries, reflecting societal norms, legislation, and historical contexts. According to a comprehensive data report by the Small Arms Survey, the United States stands out as the country with the highest rate of civilian gun ownership worldwide. With an estimated 120.5 firearms per 100 people, the U.S. ranks far ahead of countries such as Yemen, Serbia, Canada, and others, which record rates that are less than half this figure. Key findings from the data include:
- The United States leads the world in civilian gun ownership, with a rate of 120.5 firearms per 100 people.
- The next closest country is Yemen, approximately half that of the U.S, with 52.8 firearms per 100 individuals.
- Even though Canada is geographically close to the United States, its rate of gun ownership is significantly lower, standing at 34.7 per 100 people, reflecting differing legislative and societal attitudes towards firearms.
- Interestingly, countries with a history or ongoing issues of conflict, like Iraq and Afghanistan, have lower rates of civilian gun ownership than might be expected, with 19.6 and 12.5 guns per 100 people, respectively.
- A considerable proportion of European nations like Serbia, Switzerland, and Finland also exhibit relatively high rates of civilian gun ownership, ranging from 39.1 to 32.4 guns per 100 individuals. This data underscores the contrasting global attitudes and regulations surrounding firearms. As we delve further into the topic, we are confronted with the dilemma of balancing individual rights, public safety, and the societal impact of gun ownership, a question that each country must address within its unique context.
All Metrics
Countries with Highest Gun Ownership
Topping the list of countries with the highest civilian gun ownership rates is the United States, with an astonishing figure of 120.5 guns owned per 100 individuals. This is followed by Yemen, which claims the second spot with a significantly lower 52.8 guns owned per 100 individuals. Next, New Caledonia comes in third place with 42.5 guns per 100 individuals, with Serbia and Montenegro both sharing the fourth spot as they each have an average of 39.1 guns per 100 individuals. Further down the list, Canada and Uruguay both boast an ownership rate of 34.7 guns per 100 individuals, whereas Cyprus follows closely behind with an average of 34.0 guns per 100 individuals. Concluding the list of the top ten countries with the highest rates of civilian gun ownership are Finland, with an average of 32.4 guns per 100 individuals and Lebanon, averaging at 31.9 guns per 100 individuals. 10 Countries with the Highest Civilian Gun Ownership are:
- United States - 120.5 guns per 100 individuals
- Yemen - 52.8 guns per 100 individuals
- New Caledonia - 42.5 guns per 100 individuals
- Serbia - 39.1 guns per 100 individuals
- Montenegro - 39.1 guns per 100 individuals
- Canada - 34.7 guns per 100 individuals
- Uruguay - 34.7 guns per 100 individuals
- Cyprus - 34.0 guns per 100 individuals
- Finland - 32.4 guns per 100 individuals
- Lebanon - 31.9 guns per 100 individuals.
Countries With Lowest Gun Ownership
The ten countries with the lowest rates of gun ownership are Solomon Islands, South Korea, Timor-Leste, Singapore, Benin, Malawi, North Korea, Japan, Eritrea, and Turkmenistan. Both Solomon Islands and South Korea rank as the countries with the lowest rates of gun ownership, with only 0.2 civilian guns owned per 100 people. Timor-Leste, Singapore, Benin, Malawi, North Korea, and Japan all follow, reporting an average ownership of 0.3 civilian guns per 100 people. Eritrea and Turkmenistan close the list, each with an average rate of 0.4 civilian guns owned per 100 people. 10 Countries With Lowest Gun Ownership
- Solomon Islands - 0.2 guns owned per 100 people
- South Korea - 0.2 guns owned per 100 people
- Timor-Leste - 0.3 guns owned per 100 people
- Singapore - 0.3 guns owned per 100 people
- Benin - 0.3 civilian guns owned per 100 people
- Malawi - 0.3 civilian guns owned per 100 people
- North Korea - 0.3 civilian guns owned per 100 people
- Japan - 0.3 civilian guns owned per 100 people
- Eritrea - 0.4 civilian guns owned per 100 people
- Turkmenistan - 0.4 civilian guns owned per 100 people
Sources & Notes
Number of civilian-owned firearms per 100 people.
Rate per 100,000 people.
Editorial Note: Due to variations in international reporting infrastructure, this dataset reflects the most recent reporting year available for each respective country provided by the UNODC.