Best States For Education

1 | Florida | 1 | |
2 | Utah | 2 | |
3 | Massachusetts | 3 | |
4 | New Jersey | 4 | |
5 | Colorado | 5 | |
6 | Wisconsin | 6 | |
7 | Wyoming | 7 | |
8 | Connecticut | 8 | |
9 | New Hampshire | 9 | |
10 | Virginia | 10 | |
11 | Iowa | 11 | |
12 | New York | 12 | |
13 | Washington | 13 | |
14 | Nebraska | 14 | |
15 | South Dakota | 15 | |
16 | Illinois | 16 | |
17 | Minnesota | 17 | |
18 | Idaho | 18 | |
19 | Kansas | 19 | |
20 | Maryland | 20 | |
21 | North Carolina | 21 | |
22 | Montana | 22 | |
23 | California | 23 | |
24 | Vermont | 24 | |
25 | Indiana | 25 | |
26 | Georgia | 26 | |
27 | Ohio | 27 | |
28 | North Dakota | 28 | |
29 | Texas | 29 | |
30 | Missouri | 30 | |
31 | Tennessee | 31 | |
32 | Hawaii | 32 | |
33 | Delaware | 33 | |
34 | Kentucky | 34 | |
35 | Mississippi | 35 | |
36 | Rhode Island | 36 | |
37 | Nevada | 37 | |
38 | Arkansas | 38 | |
39 | Pennsylvania | 39 | |
40 | Oregon | 40 | |
41 | Michigan | 41 | |
42 | South Carolina | 42 | |
43 | Maine | 43 | |
44 | Arizona | 44 | |
45 | Alabama | 45 | |
46 | Alaska | 46 | |
47 | Louisiana | 47 | |
48 | West Virginia | 48 | |
49 | Oklahoma | 49 | |
50 | New Mexico | 50 |
Last updated April 2, 2026
The Best States for Education Depend on How You Define 'Best'
The state that ranks first for education in America spends less per K-12 student than nearly every state it outranks. That is not a typo. It is a window into what these rankings actually measure, and how much the definition of "best" shapes the answer.
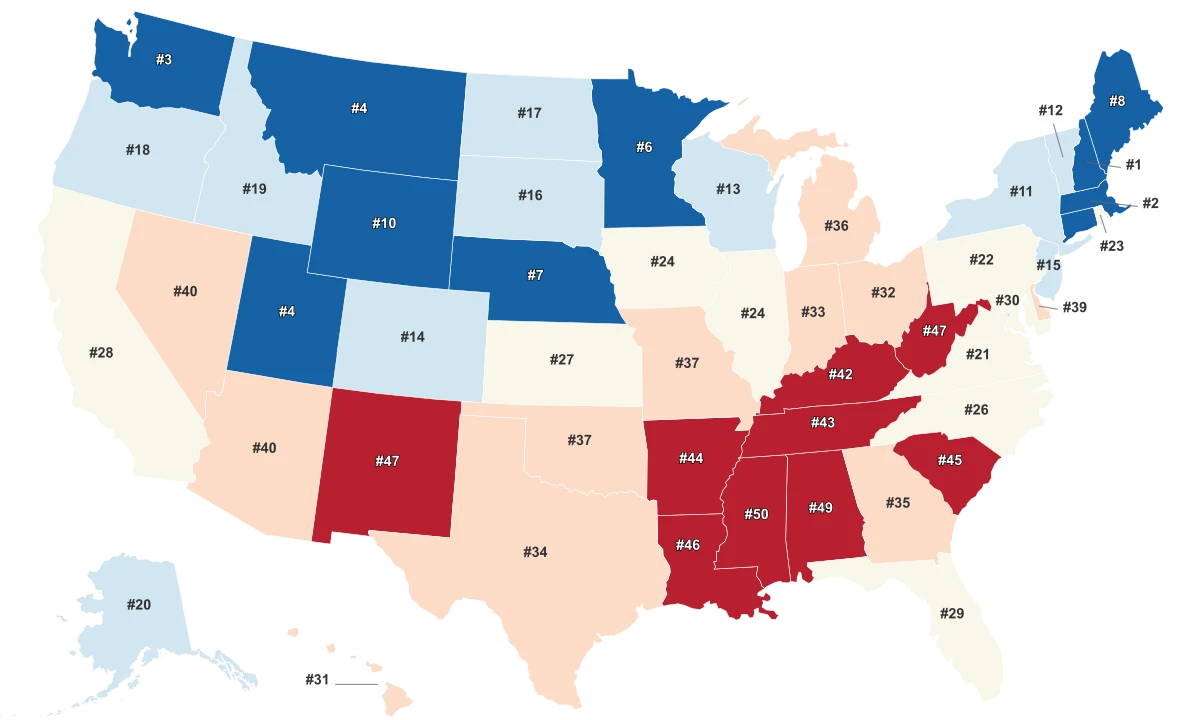
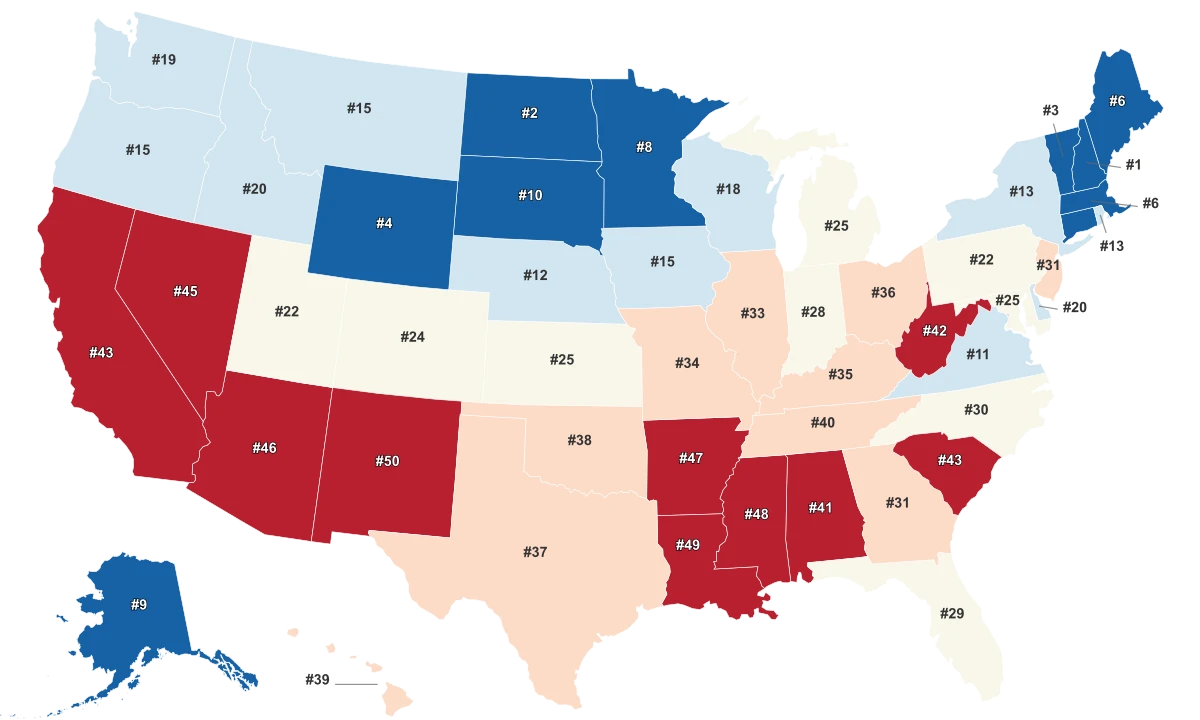
The U.S. News & World Report Education Quality Rank, which powers this page's primary ranking, evaluates states on a composite of Pre-K-12 performance and higher education outcomes. That blend matters enormously. Florida sits at the top. New Mexico sits at the bottom. In between, the usual suspects cluster near the top of the list: New Jersey, Massachusetts, Colorado, Wisconsin, and Wyoming all land in the top seven.
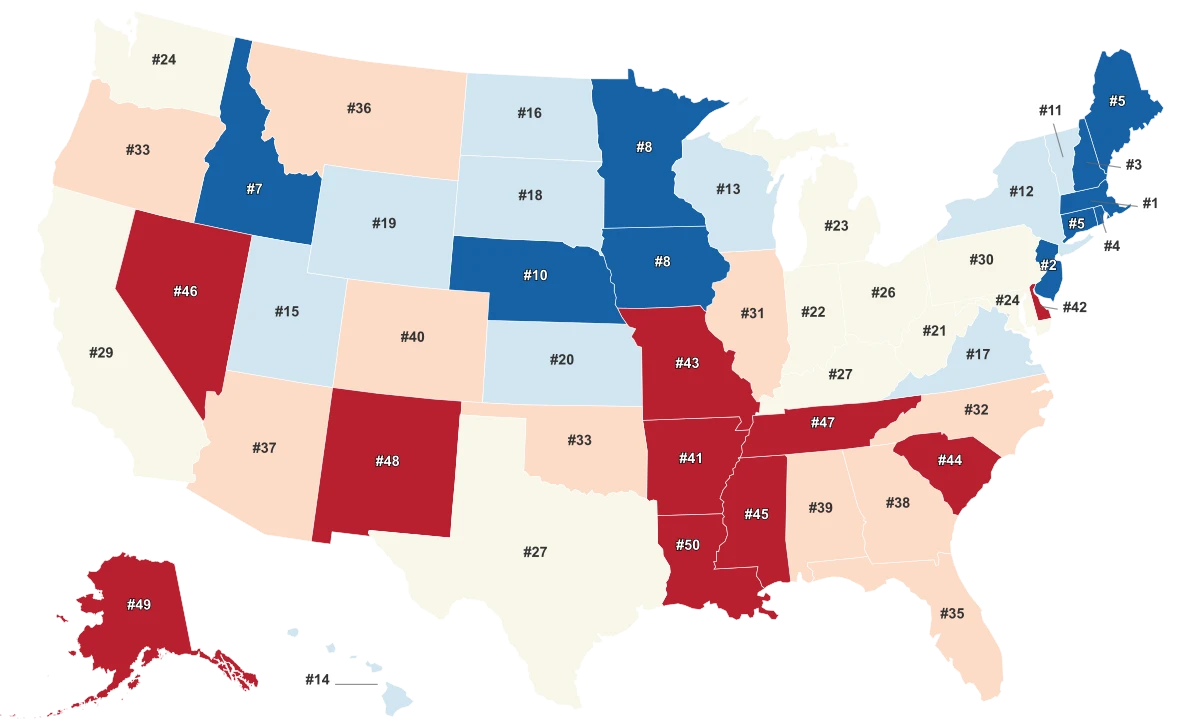
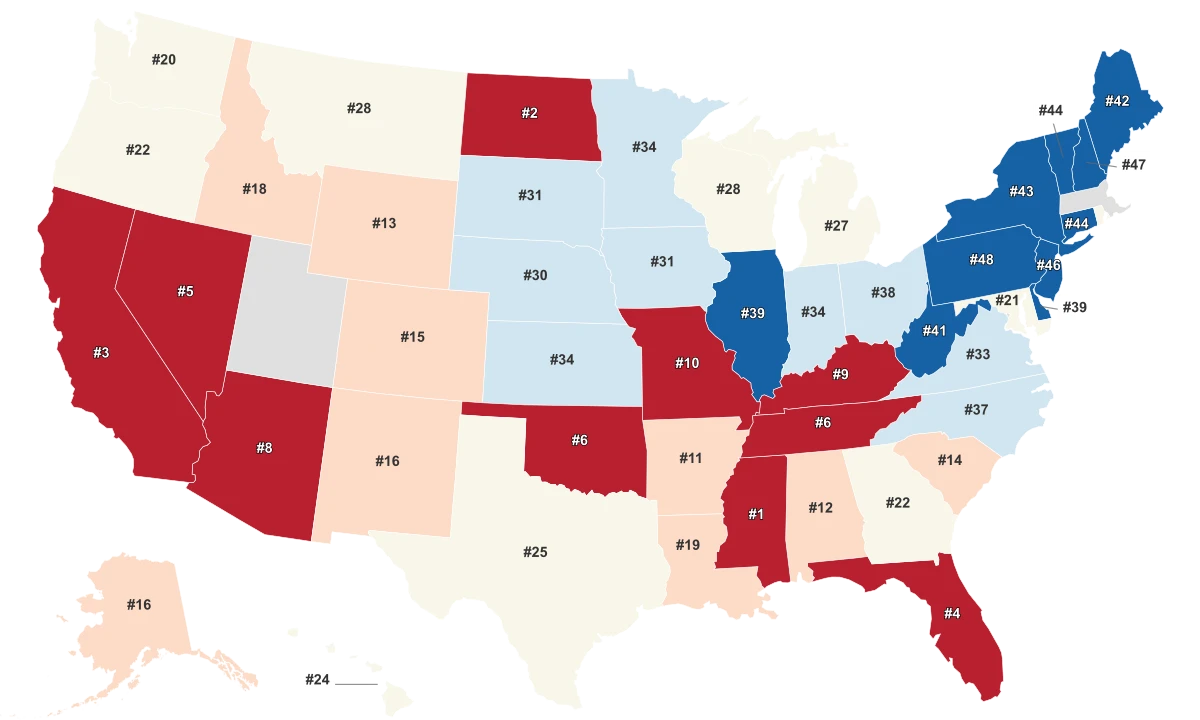
But a separate measure of educational attainment, the WalletHub Education Score, tells a different story. By that metric, Massachusetts leads the country at 82.3, more than three times the score of last-place West Virginia at 24.3. The gap between first and last is 58 points on a 100-point scale, one of the widest spreads of any state-level metric on this site. The Northeast averages an Education Score of 65.18. The South averages 44.98.
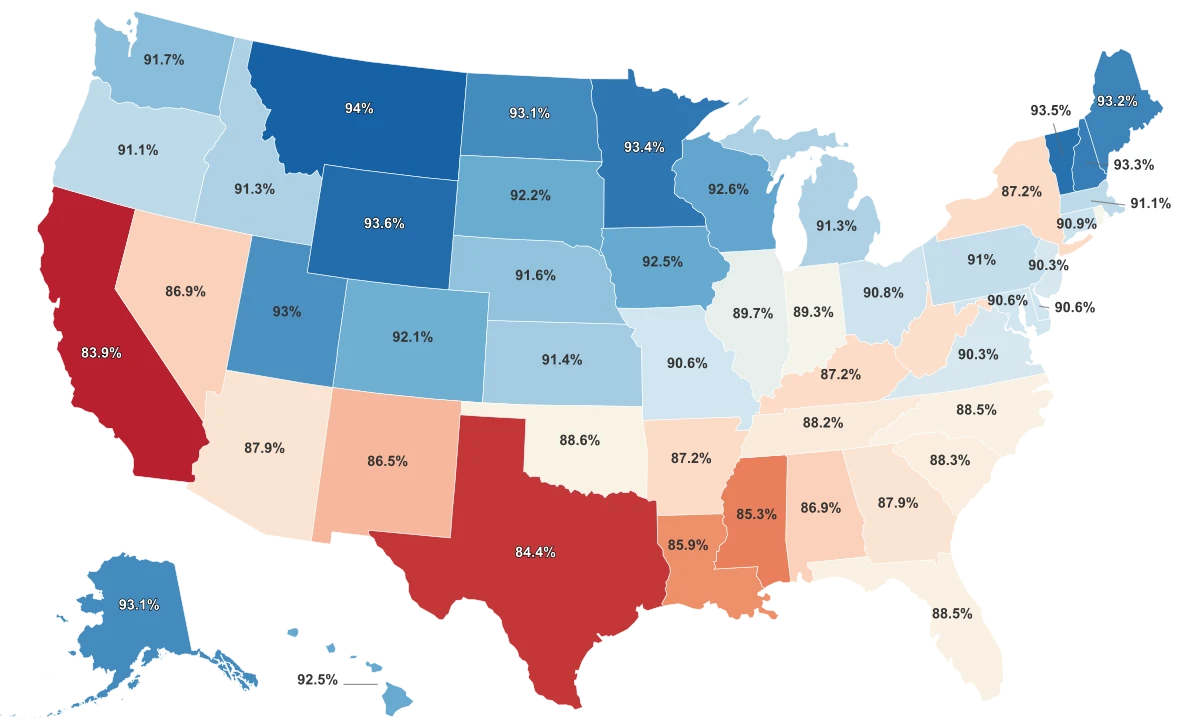
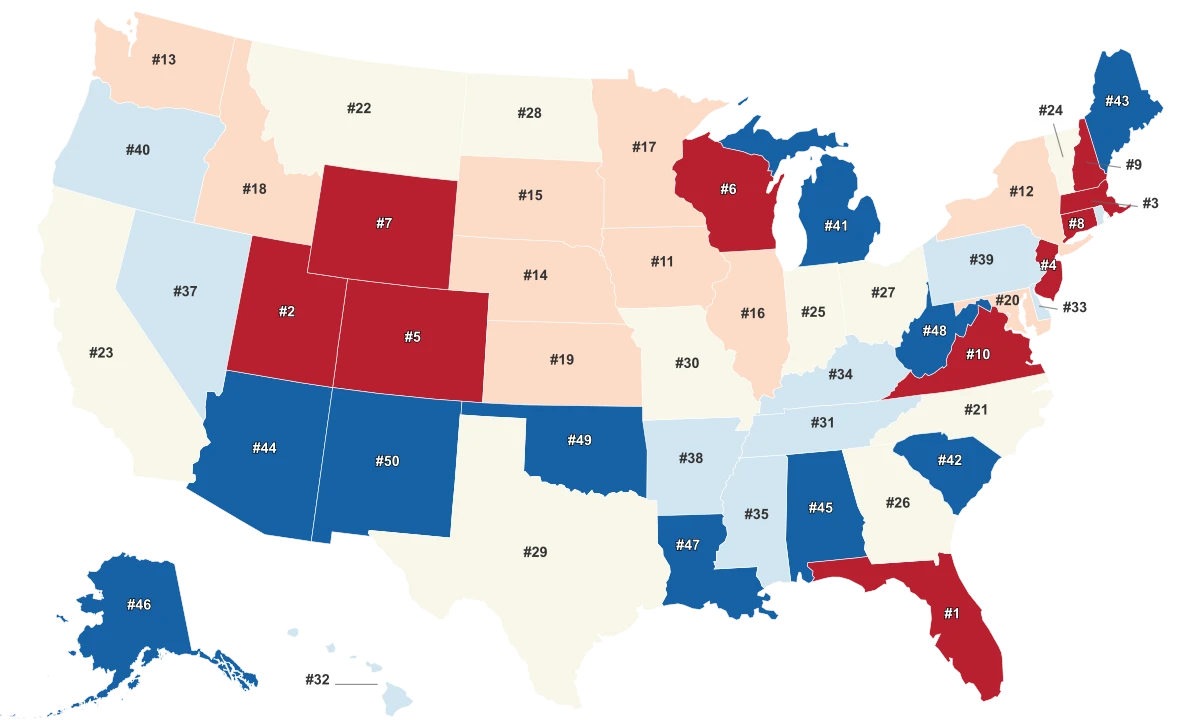
High school completion rates add another layer. Montana leads the country at 94.0%. California anchors the bottom at 83.9%, a gap of more than 10 percentage points. The reason California trails has less to do with school quality and more to do with who lives there: the state has more than one million English Learner students, roughly 17% of its K-12 enrollment, and first-generation immigrants are less likely to hold a U.S. high school credential.
All Metrics
| Region ↕ | Education Quality Index 2024↕ | Education Score 2025↕ | K-12 Spending 2025↕ | High School Completion Rate↕ |
|---|---|---|---|---|
| New Mexico | 50th | |||
| Oklahoma | 49th | |||
| West Virginia | 48th | |||
| Louisiana | 47th | |||
| Alaska | 46th | |||
| Alabama | 45th | |||
| Arizona | 44th | |||
| Maine | 43rd | |||
| South Carolina | 42nd | |||
| Michigan | 41st | |||
| Oregon | 40th | |||
| Pennsylvania | 39th | |||
| Arkansas | 38th | |||
| Nevada | 37th | |||
| Rhode Island | 36th | |||
| Mississippi | 35th | |||
| Kentucky | 34th | |||
| Delaware | 33rd | |||
| Hawaii | 32nd | |||
| Tennessee | 31st | |||
| Missouri | 30th | |||
| Texas | 29th | |||
| North Dakota | 28th | |||
| Ohio | 27th | |||
| Georgia | 26th | |||
| Indiana | 25th | |||
| Vermont | 24th | |||
| California | 23rd | |||
| Montana | 22nd | |||
| North Carolina | 21st | |||
| Maryland | 20th | |||
| Kansas | 19th | |||
| Idaho | 18th | |||
| Minnesota | 17th | |||
| Illinois | 16th | |||
| South Dakota | 15th | |||
| Nebraska | 14th | |||
| Washington | 13th | |||
| New York | 12th | |||
| Iowa | 11th | |||
| Virginia | 10th | |||
| New Hampshire | 9th | |||
| Connecticut | 8th | |||
| Wyoming | 7th | |||
| Wisconsin | 6th | |||
| Colorado | 5th | |||
| New Jersey | 4th | |||
| Massachusetts | 3rd | |||
| Utah | 2nd | |||
| Florida | 1st |
Florida Ranks First Because of Its Universities, Not Its Classrooms
If you told most people that Florida has the best education system in the country, they would probably ask for a recount. The state spends just $12,400 per K-12 student, placing it in the bottom five nationally. Its teacher salaries rank among the lowest. Its Education Score of 53.8 places it squarely in the middle of the pack.
The explanation is methodological. The U.S. News ranking blends K-12 outcomes with higher education performance, and Florida has dominated the higher education subcategory since 2017. The state's public university system charges some of the lowest in-state tuition in the country, produces high four-year graduation rates, and sends students into the workforce with relatively low debt. In the Pre-K-12 subcategory alone, Florida ranks 10th, not first.
That means the state sitting at the top of this ranking got there largely on the strength of its universities, not its classrooms. Whether that makes Florida "best" depends on whether you are a parent choosing a school district or a student choosing a college. For K-12, the picture is far less flattering.
Utah presents a similar puzzle. It ranks 2nd overall while spending the second-lowest amount per pupil in the country: just $10,000. The Utah Foundation has documented the reason: Utah has the nation's highest proportion of children relative to its total population, which stretches education budgets across more students. The state's per-pupil spending is low, but its "education effort," the share of personal income directed toward schools, is closer to the national middle. Lean administration and favorable demographics do the rest.
The States That Spend the Most Do Not Always Come Out on Top
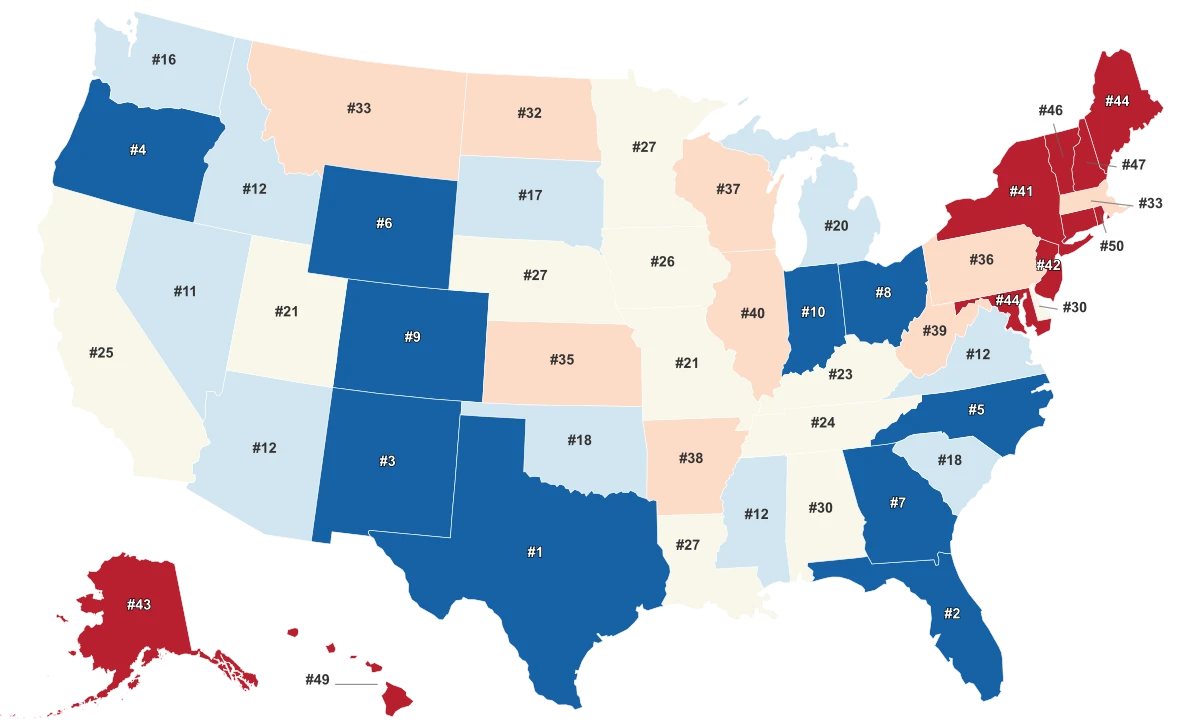
New York spends $33,400 per K-12 student, more than any other state and roughly 3.5 times what Idaho spends at $9,400. Yet New York ranks just 12th in Education Quality. Its Education Score of 57.2 places it 15th. For a state that outspends the next-closest competitor by more than $6,000 per pupil, that is a modest return.
The spending-quality disconnect is real, but it is also more complicated than "money doesn't matter." K-12 spending and the U.S. News Quality Rank show only a weak statistical relationship, largely because the ranking blends in higher-ed outcomes that have nothing to do with per-pupil K-12 budgets. When you compare spending to the Education Score instead, which measures how educated the population actually is, the relationship is considerably stronger. States that spend more per student tend to produce more educated adults.
States That Spend More on K-12 Tend to Have More Educated Populations
Education Score vs. K-12 Per-Pupil Spending across 49 states, with notable outliers at both extremes of the spending range.
The catch is that spending works best when it is targeted. Research from Northwestern University's Institute for Policy Research has found that additional K-12 funding has the largest impact on students from low-income families, not on states that are already well-resourced. A state like Connecticut, which spends $25,000 per pupil and scores 70.4, gets a measurably better return than New York, which spends $33,400 and scores 57.2. Cost of living, administrative overhead, and spending efficiency all shape how dollars translate into outcomes.
K-12 Spending Rose Nearly Everywhere Between 2023 and 2025
Per-pupil spending increased an average of 6.5% nationally, but the gains were concentrated in states that already spent the most.
Between 2023 and 2025, per-pupil K-12 spending rose 6.5% nationally. But the gains were not evenly distributed. New Jersey increased spending by 11.3%. New Hampshire rose 11.7%. At the other end, Kansas actually cut spending by 1.8%, and Nebraska held flat at $16,600. The states that were already spending the most added the most, widening the gap between the top and bottom of the spending table.
The South Trails on Every Metric, and the Causes Run Deeper Than Budgets
The regional divide in American education is stark and consistent. Across every metric in this dataset, the South finishes last. Southern states average an Education Quality Rank of 31.8 (out of 50), compared to 19.8 for the Northeast. The average Southern Education Score is 44.98, more than 20 points below the Northeast's 65.18. Southern states spend an average of $14,635 per K-12 student, roughly $10,000 less than their Northeastern counterparts.
The bottom of the Education Score ranking draws a tight geographic line. West Virginia (24.3), Louisiana (28.6), Arkansas (30.3), Oklahoma (32.5), and Nevada (34.6) make up the bottom five. West Virginia's score is a statistical outlier, falling further below the national average than any other state in the dataset. The state has the nation's lowest share of adults with a bachelor's degree, and Mountain State Spotlight has documented the cycle driving it: educated young adults leave for states with stronger job markets, shrinking the tax base that funds schools, which makes it harder to attract and retain teachers, which produces fewer graduates, which restarts the cycle.
High school completion rates follow the same contour. The South averages 87.88%, compared to 91.54% in the Midwest. But the two biggest outliers are not Southern: California (83.9%) and Texas (84.4%) sit at the very bottom nationally. Both states have large immigrant populations with significant numbers of adults who completed schooling in other countries and do not hold a U.S. high school credential. The Census Bureau's completion measure counts the entire adult population, not just those educated in American schools, which means these rates reflect demographics as much as school quality.
Massachusetts Built Its Lead Three Decades Ago
Massachusetts scores 82.3 on the Education Score, nearly 7 points above second-place Maryland and more than 58 points above last-place West Virginia. It ranks 3rd in Education Quality (behind Florida and Utah, both boosted by factors unrelated to K-12 investment). It spends $24,400 per pupil. And it has topped all four major NAEP assessment categories, 4th-grade and 8th-grade reading and math, since 2005.
The foundation for that dominance was laid in 1993. The Massachusetts Education Reform Act (MERA), triggered by a state Supreme Judicial Court ruling that the state was failing to provide an adequate education, restructured the entire K-12 system. The law established rigorous curriculum frameworks, created the MCAS standardized assessment as a graduation requirement, and built a "foundation budget" formula that increased state aid to the poorest districts.
That combination of high standards and equitable funding is what researchers at the Pioneer Institute credit for the state's sustained performance. Massachusetts did not just spend more. It spent more while simultaneously raising the bar for what students were expected to learn. The state was the first to apply a competency determination, a minimum MCAS score, as a condition of receiving a diploma.
The model is not without flaws. Achievement gaps by race and income persist, and post-pandemic scores remain below 2019 levels. But three decades later, no state has caught Massachusetts on the NAEP, and the gap between its Education Score and the rest of the country has only widened. The lesson is less about money and more about consistency: the states that invest in standards, accountability, and equitable funding, and then sustain that investment for decades, are the ones that end up at the top.
Sources & Notes
Measure of test scores, graduation rates, and educational system resources.
Measure of years of schooling and educational attainment levels achieved by the population.
% of population that successfully completes grades 9-12 secondary education.