Rape Statistics By State

1 |  | Alaska | 118.4per 100k |
2 |  | Arkansas | 72.3per 100k |
3 |  | Michigan | 58.9per 100k |
4 |  | Colorado | 58.7per 100k |
5 |  | Oklahoma | 58.6per 100k |
6 |  | Utah | 54.4per 100k |
6 |  | Montana | 54.4per 100k |
8 |  | Wyoming | 53.8per 100k |
9 |  | New Mexico | 52.7per 100k |
10 |  | South Dakota | 50.3per 100k |
11 |  | North Dakota | 50per 100k |
12 |  | Texas | 49.5per 100k |
12 |  | Nevada | 49.5per 100k |
14 |  | Nebraska | 48.4per 100k |
15 |  | Louisiana | 47.2per 100k |
16 |  | Ohio | 47per 100k |
17 |  | West Virginia | 46.5per 100k |
18 |  | Missouri | 46.4per 100k |
19 |  | Kansas | 44.3per 100k |
20 |  | Idaho | 42.9per 100k |
21 |  | Illinois | 42.5per 100k |
22 |  | Iowa | 41.3per 100k |
23 |  | Arizona | 40.5per 100k |
24 |  | Oregon | 40.4per 100k |
25 |  | District of Columbia | 39.3per 100k |
26 |  | Tennessee | 37.6per 100k |
27 |  | Washington | 37.3per 100k |
28 |  | Rhode Island | 36.7per 100k |
29 |  | Wisconsin | 36.5per 100k |
30 |  | South Carolina | 36.4per 100k |
30 |  | California | 36.4per 100k |
32 |  | Minnesota | 35.6per 100k |
32 |  | New Hampshire | 35.6per 100k |
34 |  | Indiana | 34.1per 100k |
35 |  | Kentucky | 33.5per 100k |
36 |  | Mississippi | 32.6per 100k |
37 |  | Georgia | 32.5per 100k |
38 |  | Maryland | 31.9per 100k |
39 |  | Vermont | 30.6per 100k |
40 |  | Maine | 30.3per 100k |
41 |  | Florida | 29.9per 100k |
42 |  | Virginia | 29.8per 100k |
43 |  | Alabama | 29.6per 100k |
44 |  | Hawaii | 28.4per 100k |
45 |  | North Carolina | 28.2per 100k |
46 |  | Massachusetts | 27.3per 100k |
47 |  | Pennsylvania | 25.1per 100k |
48 |  | New York | 25per 100k |
49 |  | Connecticut | 20.1per 100k |
50 |  | Delaware | 18.8per 100k |
51 |  | New Jersey | 17.9per 100k |
Last updated June 24, 2026
Key Takeaways
- Alaska records the highest rate in 2023 at 118.4 reported cases per 100,000 people, far above every other state.
- New Jersey records the lowest, at 17.9 per 100,000, with the typical state near 38.
- A higher recorded rate does not mean a state is more dangerous. It often means more victims reported and the law counted more.
- The per-capita rate and the raw number of cases barely track each other, so the count of cases is a poor guide to risk.
All Metrics
What a State's Rape Rate Actually Counts
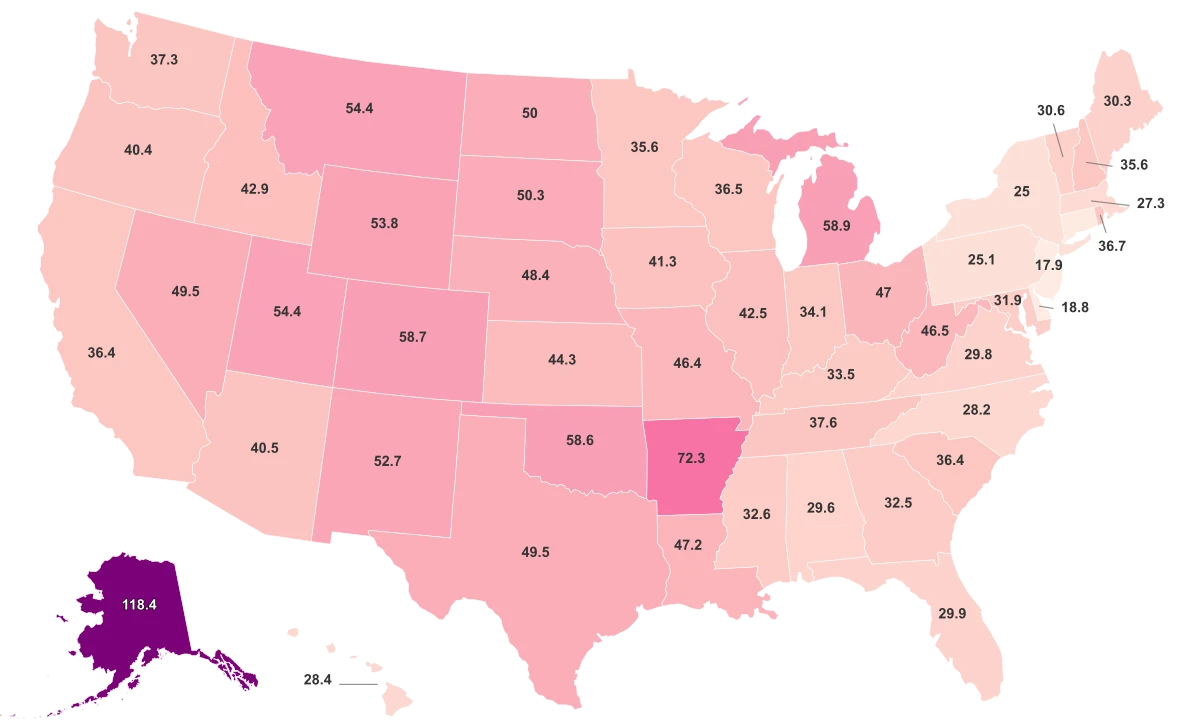
The short answer to the title question is narrow and specific. In 2023, Alaska recorded the highest rate at 118.4 reported cases per 100,000 residents, and New Jersey the lowest at 17.9. Every other state falls between those two numbers. The figures come from FBI Uniform Crime Reporting data, compiled by Statista, and they count reported, recorded offenses, not the true number of assaults.
That distinction is the most important thing to carry into the rest of the table. A rape rate is a count of cases that reached police and were recorded, divided by population. It is not a measure of how much sexual violence actually happened in a state, because most sexual assaults are never reported at all.
So the directionality here is the opposite of what it looks like. A higher number does not mark a state as more dangerous. It often marks a state where more victims came forward, where police recorded more incidents, and where the legal definition counted more acts as rape. Read the whole ranking with that in mind.
Why One State Sits So Far Above the Rest
Alaska does not just lead this ranking. It sits in a category of its own. Its recorded rate of 118.4 is more than five times New Jersey's, and about 1.6 times higher than the second-place state, Arkansas, at 72.3. No other gap in the dataset comes close.
The documented context for Alaska is about geography and reach, not danger. The same source that publishes the rate notes that responding to sexual assault in Alaska is unusually hard: communities are small, isolated, and spread across a vast area, and the state has relatively few law-enforcement employees. When an assault is reported, police can take hours or even days to reach the most remote villages.
Those conditions shape what gets recorded and how. A number that stands this far apart from the rest is a signal to look closer at the state's circumstances, not a license to rank it as the place where the most violence occurs. The recorded rate tells you what reached the system, and Alaska's system operates under conditions no other state shares.
The Number of Cases Is the Wrong Number
There is a tempting shortcut in crime data: assume the states with the most cases are the worst off. The numbers here say otherwise. Across the 50 states, the per-capita rate and the raw number of reported cases barely move together at all. A state can post one of the highest rates per person while logging a modest total, and the reverse happens just as often.
The reason is population. A large state will record more cases than a small one simply because more people live there, which tells you about size, not risk. That is why this ranking is built on the rate per 100,000 rather than the count. Ranking states by total cases would mostly sort them by population and by how many incidents their agencies recorded, two things that have little to do with how likely any individual is to be harmed.
This is the trap that makes raw counts misleading on almost every crime metric. The rate is the number that lets you compare a small state and a large one on the same footing.
The Map Tilts West, but Not by Much
There is a real regional pattern in the recorded rates, though it is gentler than the Alaska headline suggests. Grouped by Census region, the West averages the highest recorded rate at about 51 per 100,000, and the Northeast the lowest at about 28. The Midwest and South land in between.
Most states still cluster in a fairly tight band, roughly the high 20s through the mid 50s. Alaska, the country's single extreme value, sits in the West and lifts that region's average well above where its other states fall. The tilt across regions is genuine, but it is a modest lean, not a clean divide between safe regions and dangerous ones.
And the same caveat applies at the regional level. Differences in how states adopted the FBI's reporting systems, how victim services are funded, and how willing residents are to report all move these averages. A regional gap in recorded rates is not, on its own, a regional gap in how often the crime occurs.
Why a Higher Number Can Mean Better Reporting
The single biggest reason to read this ranking carefully is that the definition of the crime changed, and reporting itself is unstable. In 2013, the FBI replaced its 80-year-old definition of rape with a broader, gender-neutral one covering more acts and all victims. The bureau said plainly that it expected the number of reported rapes to rise under the new definition, and it warned that its definition "may differ from definitions in state and local laws."
That matters for a state-by-state table. States adopted the new definition and the FBI's incident-based reporting system on different timelines, so part of any gap between two states can reflect how each one counts, not how much crime each one has. A broader definition produces a bigger number from the same set of events.
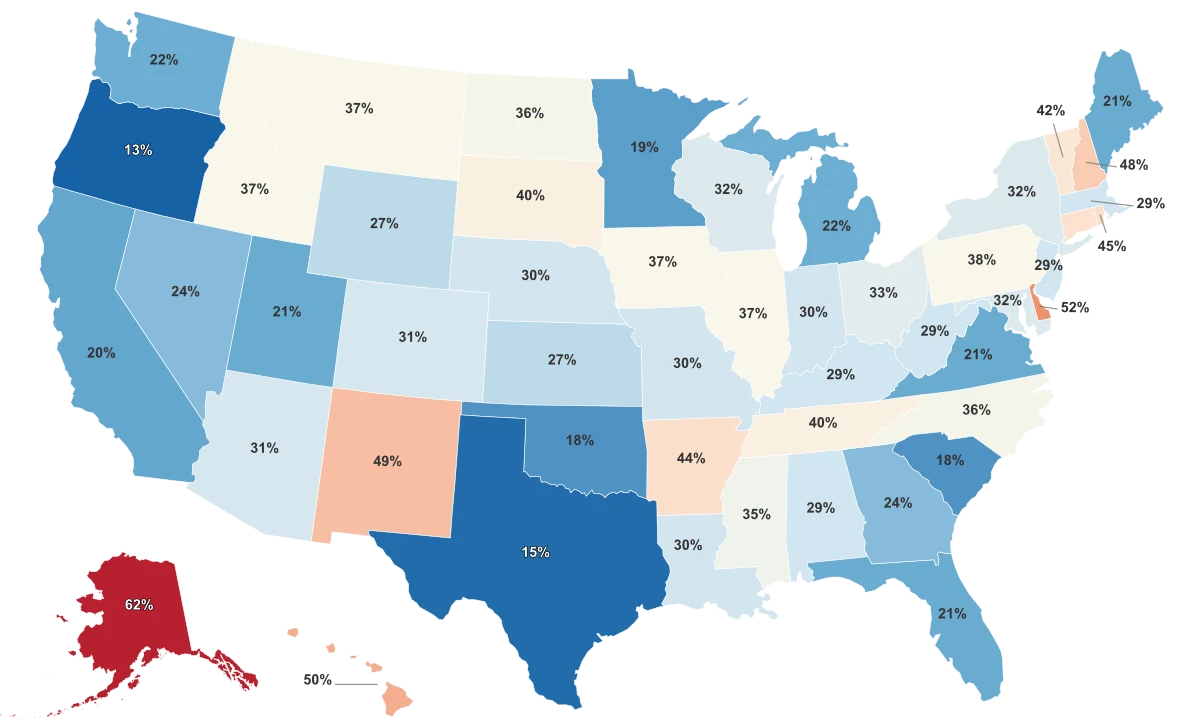
Then there is the reporting gap, which is large and moves around. According to RAINN, only about 310 of every 1,000 survivors report a sexual assault to police, citing federal justice data. The Bureau of Justice Statistics, which surveys victims directly, found the share of rape and sexual assault reported to police swung from 21% in 2022 to 46% in 2023 in its Criminal Victimization report. Even the higher figure leaves more than half of assaults out of the police numbers entirely.
One more piece of evidence argues against reading this as a danger ranking. The recorded rape rate tracks only weakly with a state's overall crime rate, drawn from the same FBI program. If a high rape rate simply marked a high-crime state, the two would rise together. They mostly do not, which is what you would expect if the rape rate is driven as much by reporting and definitions as by underlying crime.
The Recorded Rape Rate Does Not Track a State's Overall Crime
Each point is a state in 2023. If the rate simply marked dangerous places, the points would line up. They scatter instead.
Sources & Notes
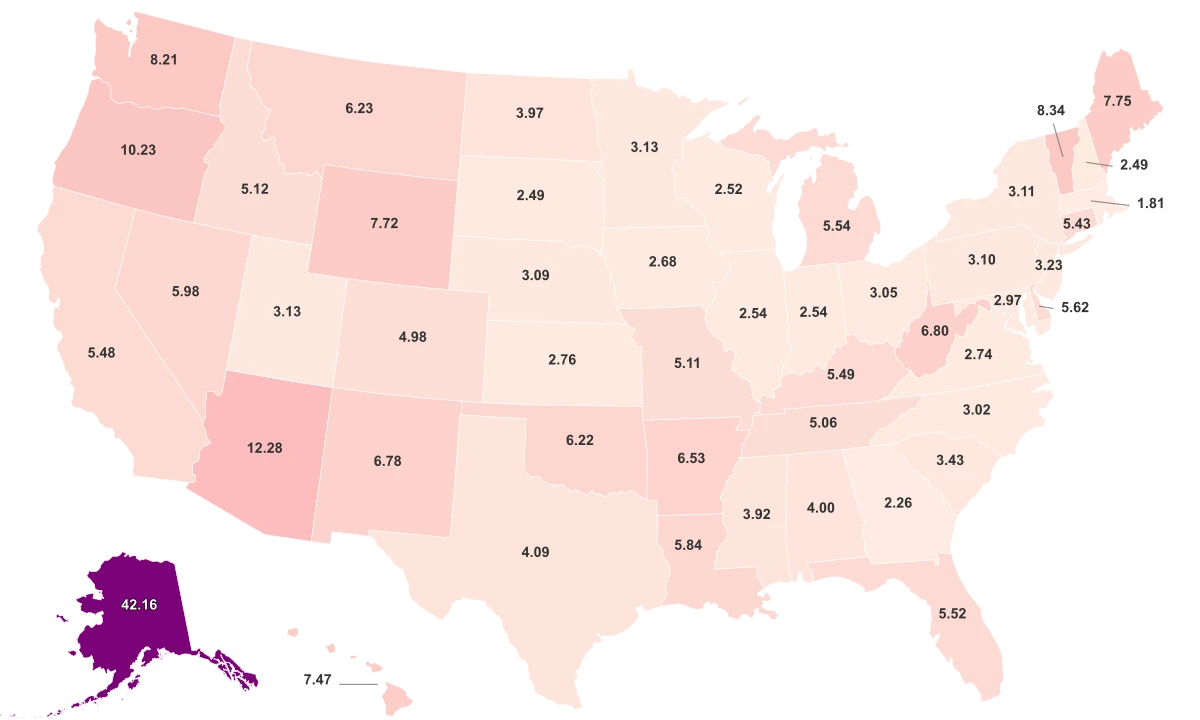
Annual number of reported rape cases per 100,000 people.
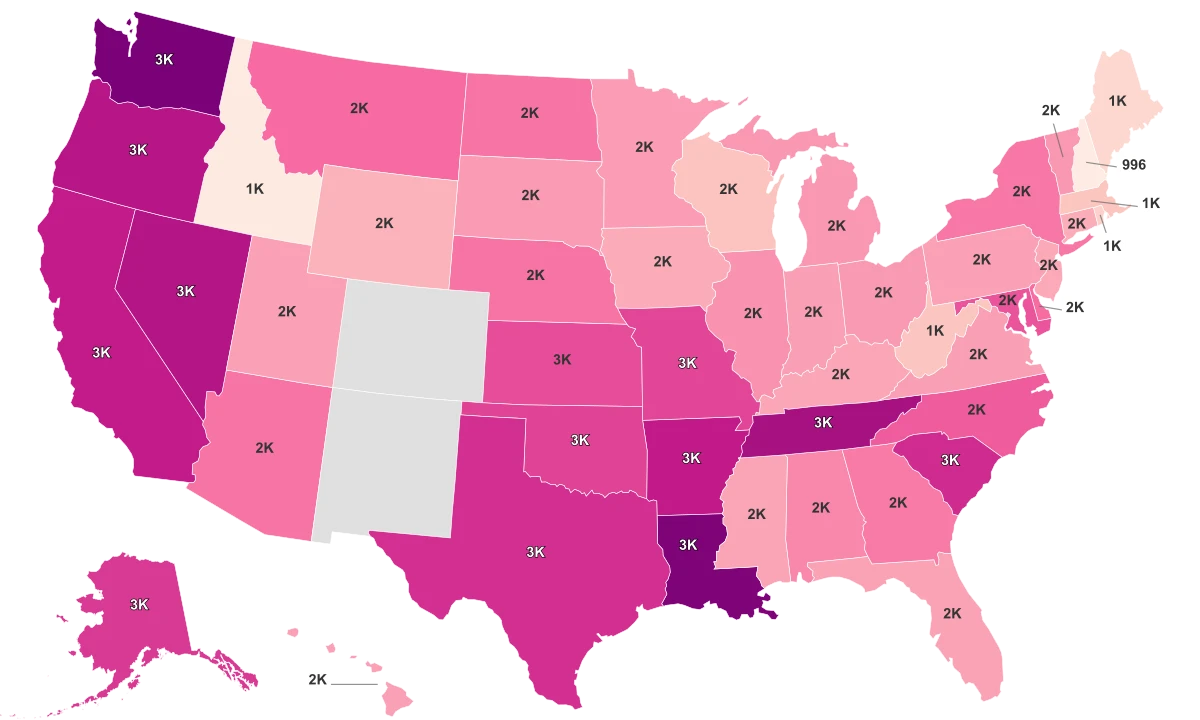
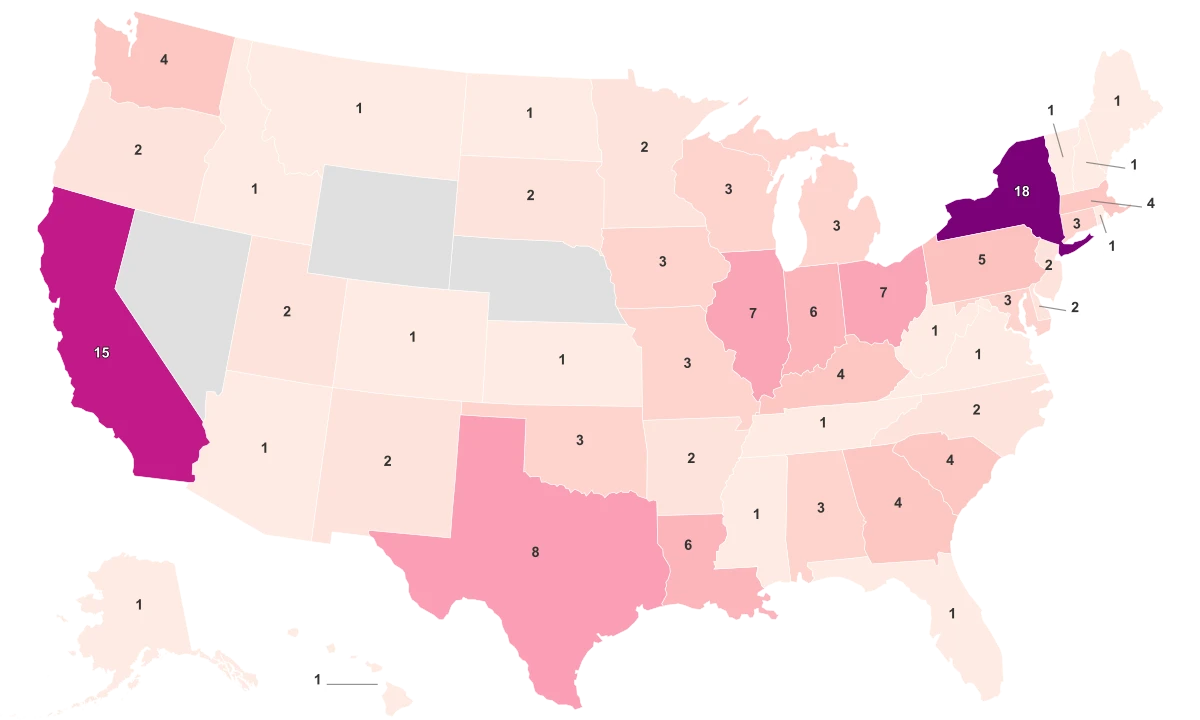
Total count of reported sexual assault crimes involving non-consensual sexual intercourse.
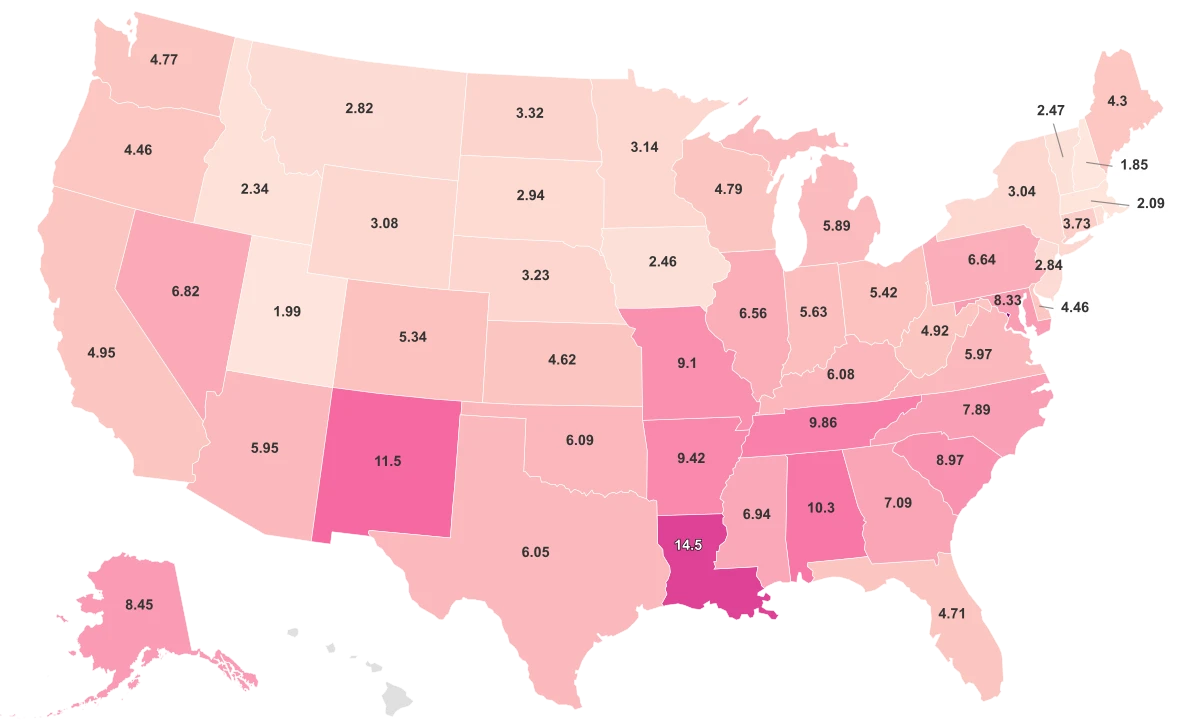
Crime rate per 100,000 people.