Countries By Sex Ratio

1— | Qatar | 246-20 (-7.5%) | |
2— | United Arab Emirates | 176-52.2 (-23%) | |
3▲1 | Oman | 166+9 (+5.7%) | |
4▼1 | Bahrain | 163-0.8 (-0.5%) | |
5▲2 | Maldives | 161+24.7 (+18%) | |
6▼1 | Kuwait | 157+0.9 (+0.6%) | |
7▼1 | Saudi Arabia | 153+16.2 (+12%) | |
8▲3 | Seychelles | 123+11.6 (+10%) | |
9— | Western Sahara | 122 | |
10▲4 | Palau | 117+8.5 (+7.8%) | |
11▼3 | Bhutan | 115+2.5 (+2.2%) | |
12▲5 | Brunei | 113+5.8 (+5.4%) | |
13— | Northern Mariana Islands | 112 | |
14▼5 | Equatorial Guinea | 111-1 (-0.9%) | |
14▼2 | Greenland | 111 | |
16▲6 | Malaysia | 110+5.4 (+5.2%) | |
17▼2 | Malta | 108-0.4 (-0.4%) | |
18▼5 | Singapore | 107-2.7 (-2.5%) | |
19▼1 | Papua New Guinea | 106-0.8 (-0.7%) | |
19— | India | 106-0.7 (-0.7%) | |
19▼3 | Jordan | 106-1.7 (-1.6%) | |
22▲2 | Marshall Islands | 105+0.6 (+0.6%) | |
22▲1 | Solomon Islands | 105+0.5 (+0.5%) | |
22▼1 | Iceland | 105-0.2 (-0.2%) | |
22▼2 | Tuvalu | 105-0.6 (-0.6%) | |
26▼2 | Andorra | 104-0.4 (-0.4%) | |
26— | China | 104-0.3 (-0.3%) | |
26▲4 | Algeria | 104+0.2 (+0.2%) | |
26▲6 | Nauru | 104+0.6 (+0.6%) | |
26▲1 | Saint Vincent and the Grenadines | 104-0.1 (-0.1%) | |
31▲15 | Pakistan | 103+1.1 (+1.1%) | |
31▲126 | Senegal | 103+6.3 (+6.5%) | |
31▲70 | Cape Verde | 103+4.1 (+4.1%) | |
31▲4 | Libya | 103+0.5 (+0.5%) | |
31▲8 | Iran | 103+0.9 (+0.9%) | |
31▼1 | Gabon | 103-0.8 (-0.8%) | |
31▲7 | Yemen | 103+0.8 (+0.8%) | |
31▲11 | Ivory Coast | 103+1 (+1.0%) | |
31▲3 | Niger | 103+0.1 (+0.1%) | |
40▲9 | Sweden | 102+0.5 (+0.5%) | |
40▲2 | Mali | 102 | |
40▼4 | Egypt | 102-0.3 (-0.3%) | |
40▲11 | Morocco | 102+0.6 (+0.6%) | |
40▲16 | Vanuatu | 102+0.8 (+0.8%) | |
40▲7 | Norway | 102+0.2 (+0.2%) | |
40▼11 | Samoa | 102-2 (-1.9%) | |
40▼4 | French Polynesia | 102-0.3 (-0.3%) | |
40— | Afghanistan | 102 | |
40▼1 | Nigeria | 102-0.1 (-0.1%) | |
40▲37 | Uzbekistan | 102+1.9 (+1.9%) | |
40▲11 | Guam | 102+0.6 (+0.6%) | |
40▲33 | Cyprus | 102+1.7 (+1.7%) | |
40▲16 | Belize | 102+0.8 (+0.8%) | |
40▲86 | American Samoa | 102+4 (+4.1%) | |
40▼13 | Timor Leste | 102-2.1 (-2.0%) | |
56▲17 | Iraq | 101+0.7 (+0.7%) | |
56▲17 | Benin | 101+0.7 (+0.7%) | |
56▲7 | Paraguay | 101+0.2 (+0.2%) | |
56▲4 | Slovenia | 101 | |
56▼14 | Cayman Islands | 101-1 (-1.0%) | |
56▼8 | Laos | 101-0.6 (-0.6%) | |
56▲6 | Comoros | 101+0.1 (+0.1%) | |
56▼14 | Honduras | 101-1 (-1.0%) | |
56▲12 | Madagascar | 101+0.5 (+0.5%) | |
56▲7 | Chad | 101+0.2 (+0.2%) | |
56▲63 | United States | 101+2.8 (+2.9%) | |
56▼2 | Luxembourg | 101-0.3 (-0.3%) | |
56▼5 | Indonesia | 101-0.4 (-0.4%) | |
56▲3 | Togo | 101-0.1 (-0.1%) | |
70▲7 | Panama | 100-0.1 (-0.1%) | |
70▼21 | Turks and Caicos Islands | 100-1.5 (-1.5%) | |
70— | Republic of the Congo | 100 | |
70▼2 | Somalia | 100-0.5 (-0.5%) | |
70▲6 | Grenada | 100-0.2 (-0.2%) | |
70▲1 | Syria | 100-0.4 (-0.4%) | |
70▼10 | Ethiopia | 100-1 (-1.0%) | |
70▼4 | Bolivia | 100-0.6 (-0.6%) | |
78▲9 | Ghana | 99.7+0.2 (+0.2%) | |
78▲16 | Liberia | 99.7+0.6 (+0.6%) | |
78▲16 | Dominica | 99.7+0.6 (+0.6%) | |
78▲14 | Suriname | 99.7+0.4 (+0.4%) | |
82▼14 | Turkey | 99.6-0.9 (-0.9%) | |
83▼1 | South Korea | 99.5-0.3 (-0.3%) | |
83▼12 | Sierra Leone | 99.5-0.9 (-0.9%) | |
83▲63 | Mauritius | 99.5+2.1 (+2.2%) | |
83▼50 | Philippines | 99.5-3.6 (-3.5%) | |
87▼2 | Ecuador | 99.4-0.3 (-0.3%) | |
88▼1 | Cameroon | 99.3-0.2 (-0.2%) | |
88▲56 | Botswana | 99.3+1.8 (+1.8%) | |
88▲4 | Burkina Faso | 99.3 | |
88▲2 | Israel | 99.3-0.1 (-0.1%) | |
88▲23 | Mongolia | 99.3+0.8 (+0.8%) | |
93▲5 | Gambia | 99.2+0.2 (+0.2%) | |
94▼12 | Gibraltar | 99.1-0.7 (-0.7%) | |
95▼1 | Myanmar | 99-0.1 (-0.1%) | |
96▲28 | Peru | 98.9+0.8 (+0.8%) | |
97▼87 | Montserrat | 98.8-13 (-12%) | |
97▲8 | Switzerland | 98.8+0.2 (+0.2%) | |
97▲19 | New Zealand | 98.8+0.5 (+0.5%) | |
97▲19 | Liechtenstein | 98.8+0.5 (+0.5%) | |
97▲14 | Chile | 98.8+0.3 (+0.3%) | |
97▲1 | Denmark | 98.8-0.2 (-0.2%) | |
97▼34 | Dominican Republic | 98.8-2 (-2.0%) | |
97▲19 | Kenya | 98.8+0.5 (+0.5%) | |
97▼11 | Sao Tome and Principe | 98.8-0.8 (-0.8%) | |
97▲5 | Netherlands | 98.8 | |
107▼51 | Micronesia | 98.7-2.5 (-2.5%) | |
107▼2 | Burundi | 98.7+0.1 (+0.1%) | |
109▼7 | Canada | 98.6-0.2 (-0.2%) | |
109▲17 | Argentina | 98.6+0.6 (+0.6%) | |
111▼45 | Fiji | 98.5-2.1 (-2.1%) | |
111▲15 | Uganda | 98.5+0.5 (+0.5%) | |
111— | DR Congo | 98.5 | |
111▼6 | Australia | 98.5-0.1 (-0.1%) | |
111▼24 | Palestine | 98.5-1 (-1.0%) | |
116▲10 | Guatemala | 98.4+0.4 (+0.4%) | |
117▲19 | Tanzania | 98.3+0.6 (+0.6%) | |
117▼36 | Sudan | 98.3-1.6 (-1.6%) | |
117▼12 | Djibouti | 98.3-0.3 (-0.3%) | |
120▲16 | Guinea | 98.1+0.4 (+0.4%) | |
121▲25 | Zambia | 98+0.6 (+0.6%) | |
121▲15 | Angola | 98+0.3 (+0.3%) | |
121▲14 | North Korea | 98+0.2 (+0.2%) | |
121▲3 | Isle Of Man | 98-0.1 (-0.1%) | |
121▼2 | Ireland | 98-0.2 (-0.2%) | |
126▼15 | Jamaica | 97.8-0.7 (-0.7%) | |
126▼7 | Haiti | 97.8-0.4 (-0.4%) | |
126▲18 | Guinea Bissau | 97.8+0.3 (+0.3%) | |
126▼7 | Taiwan | 97.8-0.4 (-0.4%) | |
126▲13 | Finland | 97.8+0.2 (+0.2%) | |
131▼49 | Albania | 97.7-2.1 (-2.1%) | |
131▲8 | Tunisia | 97.7+0.1 (+0.1%) | |
131▲28 | Kyrgyzstan | 97.7+1.2 (+1.2%) | |
134▲12 | Trinidad and Tobago | 97.6+0.2 (+0.2%) | |
134▼57 | Costa Rica | 97.6-2.5 (-2.5%) | |
134▲19 | Eritrea | 97.6+0.3 (+0.3%) | |
134▼8 | Venezuela | 97.6-0.4 (-0.4%) | |
134▲12 | Germany | 97.6+0.2 (+0.2%) | |
139▼41 | Saint Pierre and Miquelon | 97.4-1.6 (-1.6%) | |
139— | Belgium | 97.4-0.2 (-0.2%) | |
139▲7 | Colombia | 97.4 | |
139▼45 | New Caledonia | 97.4-1.7 (-1.7%) | |
143▼17 | Saint Lucia | 97.3-0.7 (-0.7%) | |
143▲11 | Czech Republic | 97.3+0.3 (+0.3%) | |
143▼38 | Cuba | 97.3-1.3 (-1.3%) | |
146▼7 | United Kingdom | 97.1-0.5 (-0.5%) | |
147▲9 | Austria | 97+0.1 (+0.1%) | |
148— | Nicaragua | 96.8 | |
148▼22 | South Sudan | 96.8-1.2 (-1.2%) | |
148▲25 | San Marino | 96.8+2 (+2.1%) | |
148▲10 | Brazil | 96.8+0.2 (+0.2%) | |
152▼98 | Tajikistan | 96.7-4.6 (-4.5%) | |
152▼37 | Bangladesh | 96.7-1.7 (-1.7%) | |
154▼49 | Eswatini | 96.5-2.1 (-2.1%) | |
154▼35 | Turkmenistan | 96.5-1.7 (-1.7%) | |
156▲5 | Spain | 96.4+0.3 (+0.3%) | |
156▲7 | Mauritania | 96.4+0.4 (+0.4%) | |
158▼32 | Cambodia | 96.2-1.8 (-1.8%) | |
158▼12 | Azerbaijan | 96.2-1.2 (-1.2%) | |
160▼21 | Vietnam | 96-1.6 (-1.6%) | |
161▲9 | Italy | 95.7+0.6 (+0.6%) | |
161— | Monaco | 95.7-0.4 (-0.4%) | |
163▲24 | Bermuda | 95.6+2.4 (+2.6%) | |
164▲35 | Cook Islands | 95.5+4.3 (+4.7%) | |
165▲3 | Slovakia | 95.4 | |
165▲11 | Malawi | 95.4+0.8 (+0.8%) | |
165▲2 | Rwanda | 95.4-0.3 (-0.3%) | |
165▲21 | Namibia | 95.4+2.1 (+2.3%) | |
169▲7 | Japan | 95.2+0.6 (+0.6%) | |
170▼24 | Lesotho | 95.1-2.3 (-2.4%) | |
171▲20 | Kazakhstan | 95+2.4 (+2.6%) | |
172▼6 | Guyana | 94.8-1 (-1.0%) | |
172▲7 | Lebanon | 94.8+0.6 (+0.6%) | |
172▲3 | South Africa | 94.8+0.1 (+0.1%) | |
172▼82 | North Macedonia | 94.8-4.6 (-4.6%) | |
176▲2 | Thailand | 94.7+0.2 (+0.2%) | |
177— | Sint Maarten | 94.5 | |
177▼4 | Kiribati | 94.5-0.3 (-0.3%) | |
179▼16 | Anguilla | 94.4-1.6 (-1.7%) | |
179▼19 | Mozambique | 94.4-1.9 (-2.0%) | |
181— | Uruguay | 94.2+0.3 (+0.3%) | |
182▼14 | Mexico | 94.1-1.3 (-1.4%) | |
182— | France | 94.1+0.5 (+0.5%) | |
184▼21 | Greece | 94-2 (-2.1%) | |
185▼3 | Romania | 93.9+0.3 (+0.3%) | |
185▼3 | Poland | 93.9+0.3 (+0.3%) | |
187▼8 | Bulgaria | 93.8-0.4 (-0.4%) | |
188▲1 | Sri Lanka | 93.7+0.7 (+0.8%) | |
189▼17 | Croatia | 93.3-1.6 (-1.7%) | |
190▼19 | Montenegro | 92.9-2.1 (-2.2%) | |
191▼89 | French Guiana | 92.8-6 (-6.1%) | |
192▼112 | Central African Republic | 92.6-7.4 (-7.4%) | |
193▼1 | Hungary | 92.5+0.4 (+0.4%) | |
194▲15 | Niue | 92.4+3.6 (+4.1%) | |
195▼3 | Barbados | 92.1 | |
196▲8 | Mayotte | 91.8+1.9 (+2.1%) | |
197▼15 | Saint Kitts and Nevis | 91.6-2 (-2.1%) | |
198▼1 | Bahamas | 91.3-0.3 (-0.3%) | |
198▲8 | Zimbabwe | 91.3+2 (+2.2%) | |
200▼4 | Nepal | 91.2-0.5 (-0.5%) | |
201▼7 | Curacao | 91-1 (-1.1%) | |
202▲4 | Portugal | 90.9+1.6 (+1.8%) | |
202▼4 | Antigua and Barbuda | 90.9-0.5 (-0.5%) | |
202▼48 | Bosnia and Herzegovina | 90.9-6.1 (-6.3%) | |
205▼2 | Estonia | 90.8+0.6 (+0.7%) | |
206▼6 | El Salvador | 90.5-0.4 (-0.4%) | |
206▼19 | Reunion | 90.5-2.7 (-2.9%) | |
208▼14 | Serbia | 90.1-1.9 (-2.1%) | |
209▼19 | British Virgin Islands | 89.9-2.8 (-3.0%) | |
210▼76 | Tonga | 89.5-8.4 (-8.6%) | |
210▼2 | Aruba | 89.5+0.4 (+0.4%) | |
210▲2 | Lithuania | 89.5+1.1 (+1.2%) | |
213▼8 | Puerto Rico | 88.8-0.7 (-0.8%) | |
214— | Saint Barthelemy | 88.4 | |
215▼5 | Georgia | 87.4-1.3 (-1.5%) | |
216▲1 | Belarus | 87.2+1.7 (+2.0%) | |
217▼2 | Ukraine | 87+0.8 (+0.9%) | |
218▼4 | Latvia | 86.6+0.3 (+0.3%) | |
218▲2 | Armenia | 86.6+4.7 (+5.7%) | |
220▼7 | Russia | 86.5-0.2 (-0.2%) | |
221▼20 | Saint Martin | 86.2-4.4 (-4.9%) | |
222▼11 | Macau | 85.3-3.2 (-3.6%) | |
223▼21 | Moldova | 85.2-5.2 (-5.8%) | |
224▼6 | Martinique | 82.9-2.5 (-2.9%) | |
225▼6 | Guadeloupe | 82.4-0.3 (-0.4%) | |
226▼10 | Hong Kong | 81.8-3.8 (-4.4%) |
Last updated June 25, 2026
Key Takeaways
- Qatar has the most male-heavy population in the world, with 246 men for every 100 women.
- Hong Kong sits at the other end, the most female-heavy place in the dataset at 81.8 men per 100 women.
- The typical country is essentially even, near 98.5 men per 100 women, so the extremes are the exception, not the rule.
- The biggest single driver of a lopsided ratio is migration: countries with huge, mostly male foreign workforces dominate the top.
All Metrics
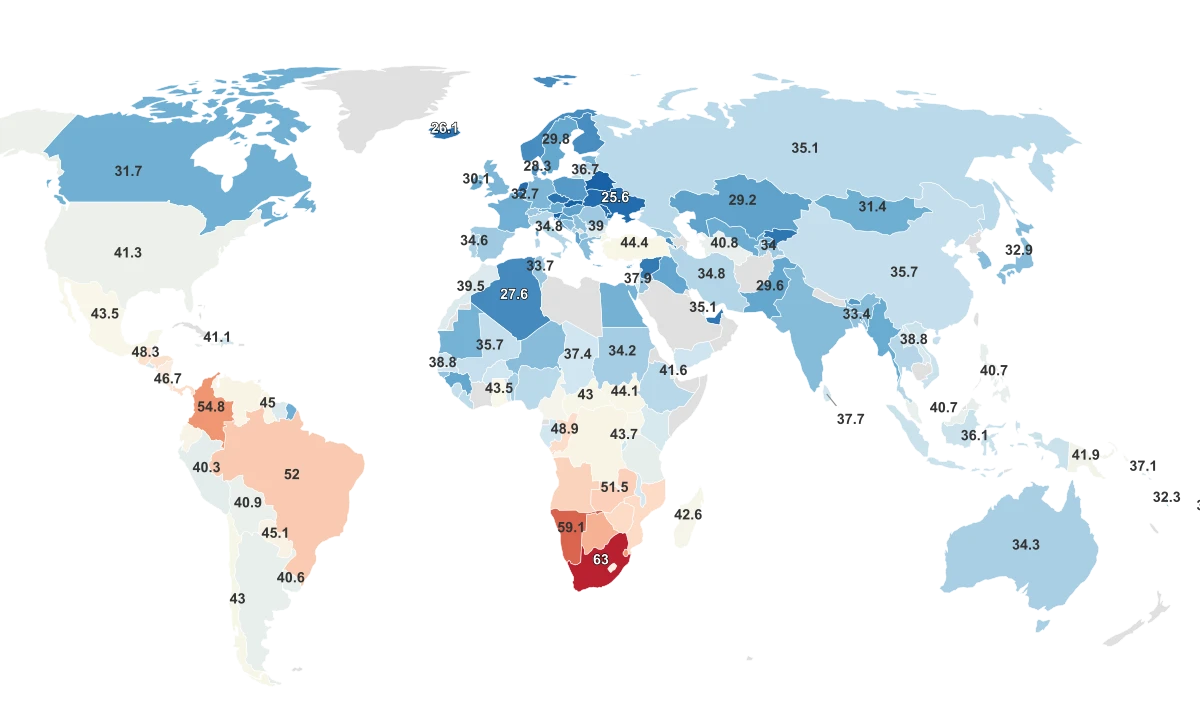
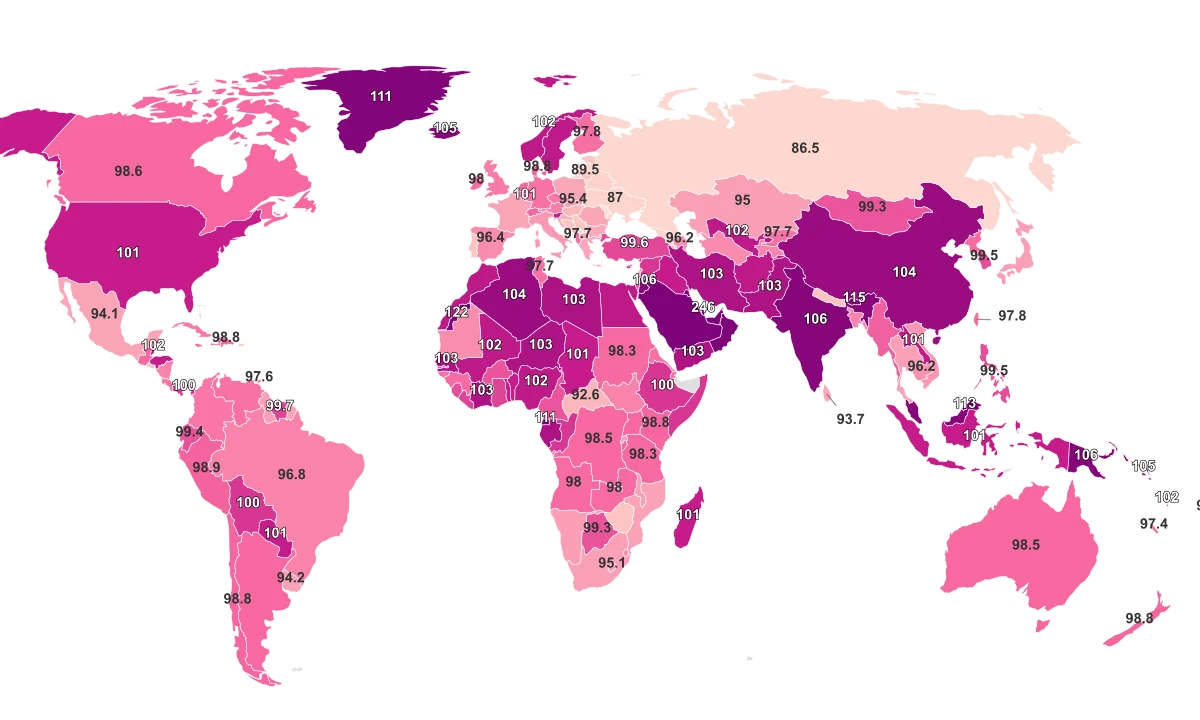
Most of the World Splits Down the Middle, and a Few Countries Don't
The sex ratio counts how many men there are for every 100 women in the total population. The figures come from the United Nations World Population Prospects 2024, the standard global source maintained by the UN Department of Economic and Social Affairs. A value of 100 means a country has exactly as many men as women. Above 100 means more men, below 100 means more women, and neither one is better or worse than the other.
By that measure, Qatar is the most male-heavy country on Earth, with 246 men for every 100 women, while Hong Kong is the most female-heavy at 81.8. Those two are the bookends of 226 countries and territories. Most of the world sits much closer to even than either extreme.
The typical country lands at about 98.5 men per 100 women, just a hair on the female side of perfectly balanced. Cluster after cluster of nations sits within a few points of that, which is why a balanced population is the rule almost everywhere. What stands out is a short run of countries at the male-heavy top that pull away from the pack, and a smaller group at the bottom where women clearly lead.
The Men Who Built the Gulf Skyline Tilted Its Population
The top of this ranking is not a scatter of unrelated countries. It is a tight Gulf and Gulf-adjacent cluster. Qatar leads at 246 men per 100 women, followed by the United Arab Emirates at 176 and Oman at 166. Bahrain, the Maldives, Kuwait and Saudi Arabia round out the seven most male-heavy populations, each sitting far above every country outside the region.
The reason is labor migration, not births. Our World in Data notes "a higher male share of the population" in Middle Eastern countries "such as Oman, the United Arab Emirates, and Saudi Arabia," and explains that "these tend to be countries with more male immigration." These economies recruit enormous foreign workforces for construction, services and domestic work, and those workers are overwhelmingly men. Because the sex ratio counts everyone living in the country, not just citizens, that imported male population shows up directly in the number.
That also means the figure can move when the workforce changes. Between 2021 and 2024, the sharpest skews eased: the United Arab Emirates fell from about 228 men per 100 women to 176, and Qatar slipped from roughly 266 to 246. The pattern is consistent with a maturing, less construction-heavy migrant labor force, though the populations remain far more male than anywhere else.
At the Bottom, Men Die Younger and Move Away
At the opposite end, women outnumber men by a wide margin, and the countries there form their own cluster. Hong Kong anchors the bottom at 81.8 men per 100 women. A band of post-Soviet states follows close behind, including Russia at 86.5, Latvia and Armenia at 86.6, Ukraine at 87.0 and Belarus at 87.2. Several French Caribbean territories sit nearby, with Guadeloupe at 82.4 and Martinique at 82.9.
The main driver here is mortality. Our World in Data reports that "in Eastern Europe, there is a higher female share of the population," tied to "much higher mortality rates in adult men than women." Almost everywhere, women also tend to live longer than men, which on its own pushes the male share below parity in older populations. Male out-migration for work adds a smaller, secondary pull in the same direction.
This is the mirror image of the Gulf story. Where migration adds men at the top, mortality and longevity subtract them at the bottom, and the same metric captures both forces at once.
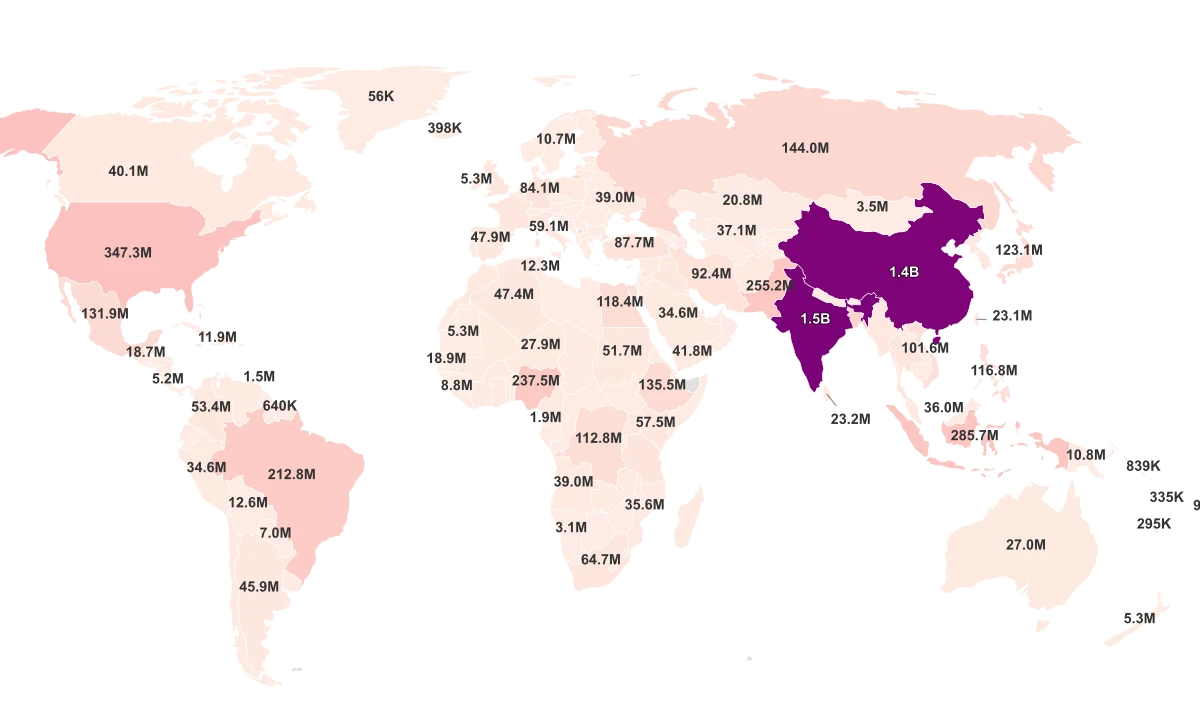
The World's Two Biggest Countries Sit Near the Middle
A reader scanning this ranking might expect the biggest countries to anchor the extremes, since they hold most of the world's people. They do not. Across all 226 countries and territories, sex balance and population size have no relationship at all, and a nation being large or small says nothing about whether it leans male or female.
The clearest example is the top of the population table. India, now the most populous country on Earth, sits at 106 men per 100 women, and China at 104. Both land just above perfect balance, in the broad middle of the pack rather than near either edge. The places that top and tail this ranking are defined by who moves in and who dies young, not by how many people they hold.
That fits the broader global picture. Pew Research, citing UN projections, reports that there are "more males than females" worldwide, but that males outnumbered females in only "86 countries" in 2021, a count projected to fall to 67 by 2050. The UN expects "parity between the sexes by 2050." The world, in other words, is only slightly tilted and slowly evening out, which makes the countries at either end of this table the real story.
Sources & Notes
Number of males for every 100 females in the population.
Total number of people.